
Think of root cause analysis as a structured way of playing detective. Instead of just dealing with the obvious clues—the symptoms of a problem—you dig deeper to find out why the problem happened in the first place. For any SaaS team, this means getting to the bottom of pesky issues like customer churn or recurring product bugs so you can create permanent solutions, not just slap on another temporary fix.
Understanding Root Cause Analysis in a SaaS Context
Imagine your app has a bug that keeps crashing a key feature. Your first instinct is probably to push a quick patch. That solves the immediate crisis, sure, but it only treats the symptom. The dodgy code that caused it is still lurking, ready to break something else down the line. This constant cycle of reactive fixes is what we call “firefighting,” and for a lean SaaS team, it’s an exhausting drain on time and energy.
An analysis of root cause (RCA) is how you graduate from firefighting to actual problem-solving. It’s about applying that same engineering discipline to the business side of things. Instead of just accepting that “users are leaving,” RCA forces you to ask why they’re leaving, and to keep asking until you hit the foundational reason.
From Symptoms to Solutions
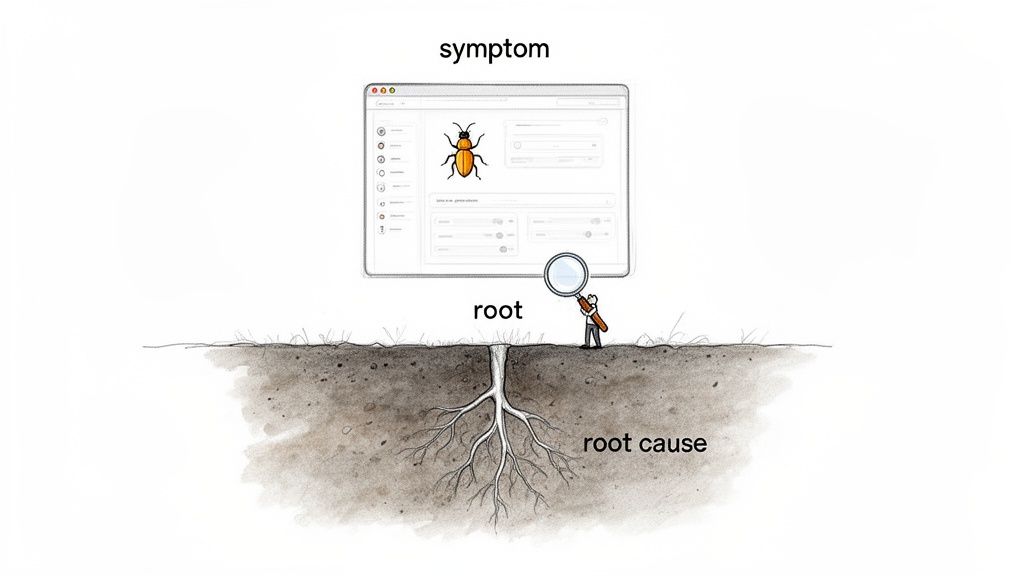
The heart of RCA is learning to tell the difference between the surface-level symptoms and the real root cause. A symptom is the visible, often frustrating, effect of a problem. The root cause is the broken process or system failure that, if you fix it, stops the problem from ever happening again.
Let’s take a classic SaaS headache: high customer churn. A quick look might show you a few symptoms:
- Users bail right after their free trial ends.
- Support tickets are piling up with complaints about a confusing feature.
- Your analytics show people aren’t engaging with your core workflow.
While these are all problems, they aren’t the root cause. They’re breadcrumbs leading to a much bigger issue. A proper analysis of root cause connects these dots. It might reveal your onboarding is failing to show the product’s value in the first five minutes. That confusion leads to low engagement, which ultimately causes people to churn. To dig deeper into that specific challenge, check out our guide on reducing churn in SaaS.
A root cause is the fundamental, highest-level cause that, if removed, prevents the problem from recurring. It’s the difference between mopping up a spill and fixing the leaky pipe.
The Value for Lean SaaS Teams
For bootstrapped founders and small teams, adopting RCA isn’t just good practice—it’s a survival tactic. You don’t have a massive support department or an army of engineers. Every hour spent tackling the same old problems is an hour you’re not spending on growing the business.
By finding and fixing the true source of an issue, you build a more stable, resilient, and user-friendly product. This proactive mindset leads directly to happier customers, better retention, and a solid foundation for sustainable growth.
Choosing the Right Framework for Your Analysis
Jumping into a root cause analysis without the right tool is like trying to turn a screw with a hammer. You might make a dent, but you won’t get to the heart of the problem. Choosing the proper framework isn’t just about process; it’s about efficiency and clarity.
Think of these frameworks as different lenses for looking at a problem. Each one gives you a unique perspective, helping you organise your thoughts and steer your investigation. By building up a small toolkit of these methods, you’ll be ready to tackle anything from a sudden drop in sign-ups to a pesky, recurring bug.
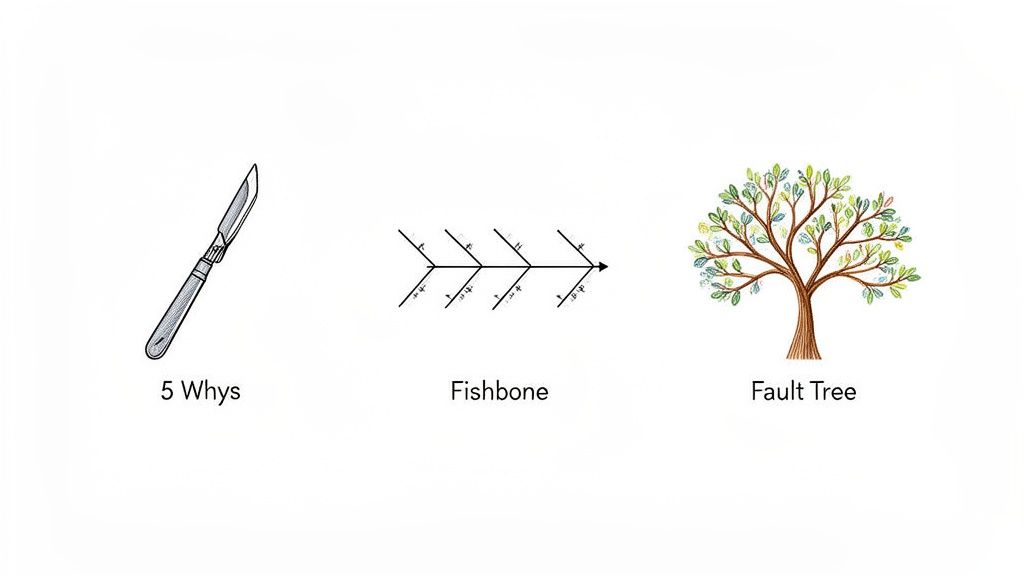
The 5 Whys for Quick and Direct Problems
The 5 Whys method is the scalpel in your analytical toolkit. It’s simple, lightning-fast, and surprisingly effective for straightforward issues where the chain of events isn’t a tangled mess. The process is exactly what it sounds like: state the problem and ask “Why?” five times, letting each answer lead you to the next question.
This relentless questioning forces you past the obvious symptoms and down a direct path to the real issue. It’s brilliant for sniffing out human error or process gaps that are often hiding just a layer or two beneath the surface.
Let’s say your SaaS team sees a spike in support tickets about failed payments.
- Why are payments failing? Because the payment gateway is rejecting them.
- Why is it rejecting them? Because our API key has expired.
- Why did the key expire? Because no one updated it when we got the renewal email.
- Why wasn’t it updated? Because the email went to a former employee’s inbox.
- Why was the notification sent there? Because we have no formal process for updating contacts for critical services.
Bingo. The root cause isn’t a technical glitch but a process failure. The real fix isn’t just updating the key; it’s creating a shared, managed system for all critical service credentials.
Fishbone Diagrams for Complex Interconnected Issues
Sometimes, a problem has roots stretching into multiple parts of your business, and the linear 5 Whys just won’t cut it. That’s where the Fishbone Diagram (or Ishikawa Diagram) comes in. It’s a visual brainstorming tool that helps you map out and categorise every potential cause, so you can see the bigger picture.
This method is perfect for messy challenges like a slow rise in customer churn, where the cause could be anything from your product and pricing to your people and processes. The diagram’s structure encourages you to think broadly, making sure no stone is left unturned.
The Fishbone Diagram helps you map out all the potential contributing factors to a problem, preventing you from fixating on the most obvious symptom and guiding a more thorough investigation.
You start by drawing a “skeleton.” The “head” of the fish is your problem (e.g., “Decreasing Trial-to-Paid Conversion”), and the “bones” coming off the spine are categories of potential causes. For a SaaS business, common categories might include:
- Product: Missing features, confusing UI, bugs, slow performance.
- People: Inadequate support, slow response times, poor sales training.
- Process: Clunky onboarding flow, confusing pricing, bad communication.
- Promotion: Misleading marketing copy, targeting the wrong audience.
From there, your team can brainstorm specific causes for each category, creating a complete map of possibilities to investigate.
Fault Tree Analysis for Critical System Failures
For the really high-stakes issues—especially technical ones where a failure could be catastrophic—Fault Tree Analysis (FTA) offers a more structured, top-down approach. You start with a specific, unwanted outcome (like “Database Outage”) and work backwards to map every single event that could lead to it.
FTA is a deductive method that uses logic to map the relationships between hardware failures, software bugs, and human error. It’s a bit more specialised, but it’s incredibly valuable for finding single points of failure in your infrastructure. By mapping every possible path to disaster, you can proactively build in redundancies and safeguards to prevent it from ever happening.
A Comparison of Root Cause Analysis Frameworks
Choosing the right framework from the get-go saves you time and leads to better insights. This quick-reference guide will help you pick the best RCA method for your specific SaaS challenge.
| Framework | Best For | Key Benefit | Example Use Case |
|---|---|---|---|
| The 5 Whys | Simple, linear problems with a clear cause-and-effect chain. | Speed and simplicity. Gets to a likely root cause in minutes. | A sudden spike in user-reported login errors. |
| Fishbone Diagram | Complex problems with multiple potential causes across different teams or systems. | Visual and collaborative. Encourages comprehensive brainstorming. | A gradual decline in customer satisfaction scores. |
| Fault Tree Analysis | High-risk, critical system failures where prevention is paramount. | Rigorous and quantitative. Identifies all potential failure paths. | Investigating the risk of a critical data breach or server outage. |
Ultimately, the best tool is the one that fits the problem. Having a few different frameworks in your back pocket means you’re prepared to dig into any issue, big or small, and find a solution that sticks.
A Step-by-Step Guide to Conducting Your Own RCA
Alright, you’ve got the frameworks down. Now it’s time to roll up your sleeves and put that theory to work. A root cause analysis isn’t some abstract thought experiment; it’s a structured investigation, a detective story where the goal is to find actionable answers.
Think of this five-step process as your playbook. It’ll take you from a vague, frustrating problem to a specific, solvable cause—all backed by real user data. It’s like assembling a puzzle, where each step gives you a new piece until the full picture snaps into focus. Let’s walk through how to conduct a proper RCA for common SaaS headaches, like a sudden spike in churn or a dip in conversions.
Step 1: Define the Problem with Precision
The single biggest mistake teams make is starting with a fuzzy problem. Statements like “user engagement is down” or “customers are churning” are symptoms, not problems. They’re way too broad to guide a focused investigation.
You need a clear, measurable problem statement that acts as your north star. A strong definition is specific, quantifiable, and has a clear timeframe.
- Weak: “Users aren’t converting after the trial.”
- Strong: “Our trial-to-paid conversion rate dropped from 25% to 10% in the last 30 days for users who signed up after our latest feature release.”
See the difference? That second statement gives your investigation immediate direction. It points you to a specific timeframe, a user segment, and a potential trigger (the new feature), turning a wide-open mystery into a solvable case.
Step 2: Gather the Right Data
With a sharp problem definition in hand, your next job is to gather evidence. This isn’t about hoarding every scrap of data you can find. It’s about strategically collecting both the numbers and the stories that relate directly to your problem statement.
Quantitative data tells you what is happening—think user activity logs, conversion funnel drop-off points, and feature adoption rates. Qualitative data tells you why it’s happening. This is where you find the human context behind the numbers.
This is exactly where a tool like HappyPanda becomes your best friend. You can deploy targeted, in-app surveys to the precise user segment you defined in step one. For instance, you could trigger a simple one-question survey for users whose trial just expired, asking, “What was the main reason you decided not to upgrade?”
Step 3: Identify Causal Factors
Now you have your data—the what and the why. The next move is to connect the dots and start flagging potential causal factors. This is the perfect time to pull out one of the frameworks we discussed earlier, like the 5 Whys or a Fishbone Diagram, to give your brainstorming some structure.
Lay out all your evidence and start mapping the potential relationships. Did the conversion drop line up with a new marketing campaign? Do your survey responses keep mentioning a confusing part of the UI?
In Southeast Asia’s booming SaaS market, this step often hits pay dirt. Research shows that for many bootstrapped companies, a common root cause of churn is a fragmented communication stack, leading to abandonment rates 40-60% higher than on integrated platforms. An analysis of over 500 regional firms found that 68% of churn incidents came from poor onboarding and disjointed feedback loops—something a proper analysis would uncover in a heartbeat.
Step 4: Isolate the True Root Cause
By now, you probably have a shortlist of contributing factors. The goal here is to drill down and find the one true root cause—the single domino that, if you removed it, would stop the whole chain from falling.
Go through your list of causal factors and for each one, ask, “If we fixed this, would the problem definitely go away?” Keep asking that question until you hit a foundational issue.
Example Scenario Problem: Trial-to-paid conversion dropped 15%. Causal Factors Identified:
- Users found the new “Project Templates” feature confusing.
- The in-app onboarding checklist didn’t mention the new feature.
- A welcome email sequence had a broken link to the help docs.
While all of these are problems, the real root cause is likely #2. The lack of onboarding guidance created the confusion (#1), and the broken link (#3) was just a secondary frustration, not the main reason people left. The core failure was not showing users the value of the new functionality. For those wanting a deeper dive, Sheridan Technologies offers a practical guide to Root Cause Analysis Engineering which is a great next read.
Step 5: Implement and Monitor Your Solution
You’ve found it—the root cause. The final, and most important, step is to implement a fix and then watch it like a hawk. A fix is only a solution if it actually solves the problem.
In our example, the solution would be to update the onboarding checklist to include a step for setting up the new “Project Templates.” But you can’t just ship it and forget it. You have to monitor your key metric—the trial-to-paid conversion rate—to confirm it climbs back to its baseline. This last step is crucial for closing the feedback loop and making sure your detective work leads to real business improvements.
Real-World Examples of Root Cause Analysis in Action
Frameworks and step-by-step guides are great blueprints, but seeing a root cause analysis unfold in a real scenario is what makes the concept click. Abstract problems suddenly become tangible when you can trace the path from a frustrating symptom all the way back to its hidden source.
Let’s walk through two common SaaS challenges through the lens of RCA. These stories show how asking the right questions—and using simple tools to find the answers—can lead to fixes that genuinely move the needle on retention and growth.
The Case of the Silent Churn
Imagine a small SaaS company, “ScheduleFlow,” that just launched a powerful new “Team Calendar” feature. Everyone’s excited, but a month later, the numbers are grim. Churn has spiked by 15%, yet the support inbox is eerily quiet. No angry emails, no bug reports—just a steady stream of users cancelling their subscriptions.
This is silent churn, and it’s terrifying. The founder is flying blind, stuck treating symptoms without a diagnosis. Is it the price? Is the core product failing? Or is the new feature a complete flop? Guessing is a luxury they can’t afford.
To get answers, the founder takes a simple, targeted approach. They set up an in-app survey to appear only for users who have engaged with the new Team Calendar at least once but are now on the cancellation page. The survey asks one direct question: “What was the one thing that stopped you from using the Team Calendar more?”
The responses start rolling in, and a clear pattern emerges. Over 80% of the feedback isn’t about the feature’s value at all—users actually love the idea of it. The problem is they can’t figure out how to get it set up. The documentation is buried in a help centre somewhere, and the in-app prompts are vague.
The Root Cause: The feature’s initial setup process was confusing due to poor documentation and a lack of in-app guidance. This caused so much frustration that users abandoned the product before ever experiencing its real value.
The fix was straightforward. The ScheduleFlow team created a two-minute walkthrough video, added “Set up your Team Calendar” to the onboarding checklist, and sprinkled in a few helpful tooltips on the setup page. Within a month, churn rates for this group of users returned to normal.
This simple flow shows how a proper root cause analysis moves from a problem to a real solution.
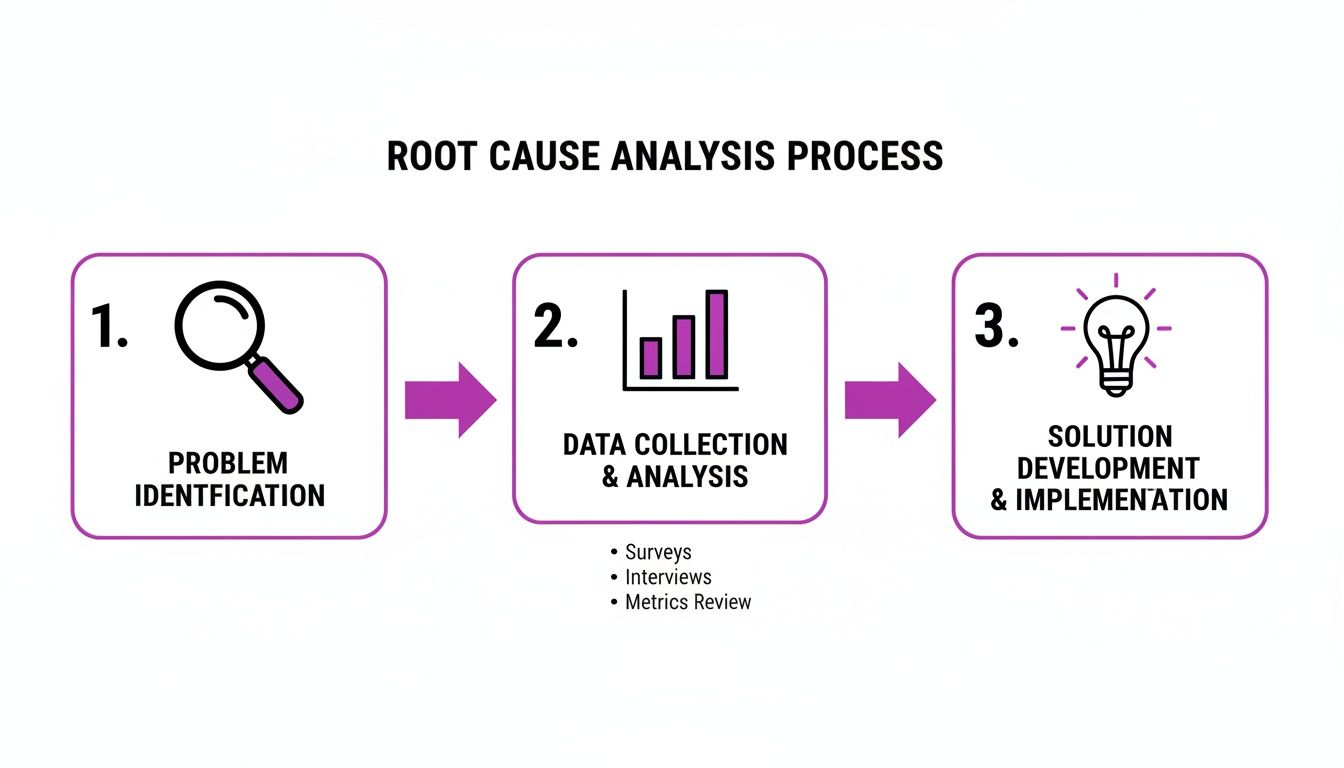
This visual just hammers home the point: without collecting the right data, you’re just taking a stab in the dark.
The Onboarding Drop-Off Mystery
Our second story involves “DataDash,” a new analytics tool. The founder spots a worrying trend in their product analytics. During onboarding, a whopping 60% of new users are abandoning the flow at the exact same step: “Connect Your Database.”
The team’s immediate assumption is that the integration must be broken. Engineers spend days trying to replicate the error, testing every possible database connection they can think of, but they find nothing. The integration works perfectly. Frustrated, they start considering a complete rebuild of the feature—a massive project for a small team.
This is a classic case of focusing on a symptom (the drop-off) without understanding the cause. Before committing to a rebuild, the founder decides to gather some direct user feedback, right at the point of friction.
Using a tool like HappyPanda, they deploy a tiny, non-intrusive survey that appears on the “Connect Your Database” page only after a user has been inactive for more than 60 seconds. It simply asks, “Anything causing you to pause here?”
The answers were immediate and incredibly revealing. Users weren’t hitting a technical bug. The real issue was a single, vague line of text in the UI. The instruction said, “Enter your database credentials,” but it failed to mention that users first needed to whitelist DataDash’s IP address in their database firewall. The tech-savvy users figured it out, but most were just left confused and gave up.
- Symptom: Users abandoning the onboarding process.
- Assumed Cause: A broken database integration.
- Actual Root Cause: Unclear instructions that skipped a critical prerequisite step (IP whitelisting).
The solution took all of five minutes to implement. They changed the instructional text to be more explicit and added a link to a short guide on IP whitelisting. The very next day, the drop-off rate at that step plummeted from 60% to less than 5%.
Both of these examples highlight a core principle of effective root cause analysis: the answer is almost always with the user. When you move beyond your internal assumptions and gather targeted feedback at the moment of friction, you can uncover the true source of a problem and implement a simple fix that saves time, boosts retention, and makes for a much better user experience.
How an Integrated Platform Makes Your RCA Process a Whole Lot Easier
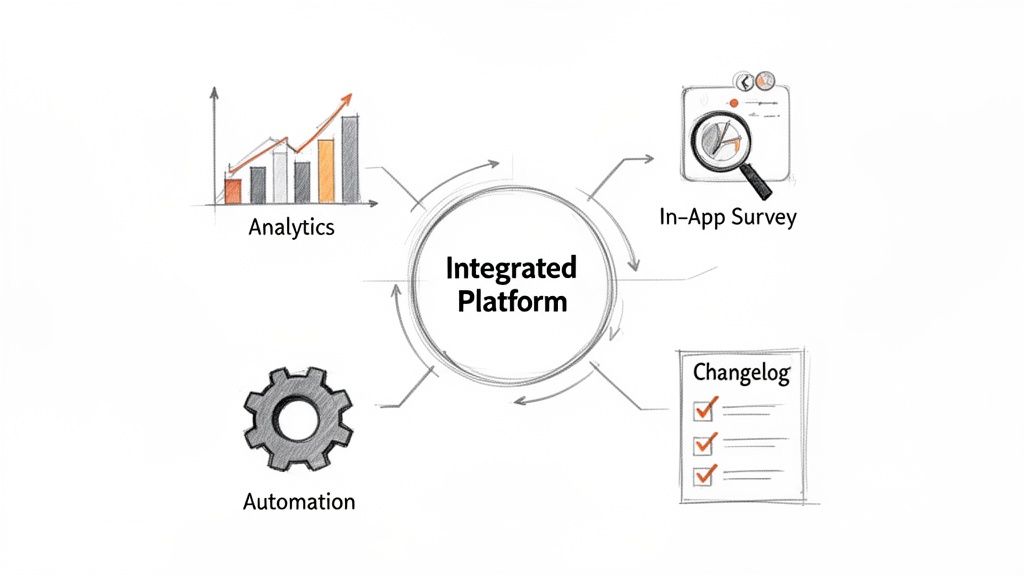
For a lean SaaS team, trying to conduct a proper analysis of root cause can feel like assembling a puzzle with pieces scattered all over the house. Your analytics live in one tool, user surveys in another, and customer support emails are buried somewhere else entirely. This fragmentation doesn’t just create friction—it wastes precious time and makes connecting the dots nearly impossible.
Juggling a dozen subscriptions and browser tabs is more than just an annoyance; it’s a genuine barrier to insight. Every tool has its own learning curve and integration quirks. The time you spend exporting CSVs and trying to match user IDs is time you aren’t spending on solving the actual problem. This is where an integrated platform becomes your command centre for RCA.
By bringing your data collection, communication, and analysis under one roof, you can finally move from a pile of disjointed data points to a clear, cohesive story. Instead of battling tool sprawl, you get to focus your energy on what really matters: figuring out why your users are doing what they’re doing.
Centralising Data Collection Right at the Point of Friction
The most valuable insights for an analysis of root cause come directly from users at the exact moment they hit a snag. An integrated platform like HappyPanda lets you collect this crucial qualitative data without wrecking the user experience or needing a complex technical setup.
Imagine you’ve spotted a drop-off point in your onboarding funnel. Instead of sending out a generic email blast days later (when everyone’s forgotten what happened), you can trigger a targeted, in-app survey that pops up only for users who stall on that specific page. That immediacy is the secret to getting honest, top-of-mind feedback.
- Targeted Surveys: Pinpoint user segments based on behaviour (like a trial ending or a feature being ignored) to ask the right questions at the right time.
- Contextual Feedback: Collect data right inside your product, while the experience is still fresh in the user’s mind.
- Unified Analytics: See survey responses alongside user activity data in one place, which means no more manually stitching together different datasets.
This approach transforms your RCA from a reactive, after-the-fact investigation into a proactive, real-time diagnostic process. You can start gathering clues the moment you notice a symptom, dramatically shortening the time it takes to find the root cause.
An integrated platform acts as your single source of truth for user feedback and behaviour. This consolidation is vital for seeing the complete picture and making connections that would otherwise be lost between siloed tools.
Automating the Investigation and Closing the Loop
Once you’ve collected the data, the next challenge is acting on it without drowning in manual tasks. The real power of an integrated platform is its ability to automate the follow-up, helping you dig deeper without lifting a finger. You can create simple rules that trigger actions based on user feedback or behaviour.
For instance, you could set up an automation where a user who leaves a low NPS score immediately gets a follow-up email asking for more detail. This helps you zero in on causal factors much faster. You can learn more about why this is so effective in our article on building a single source of truth for your customer data.
On top of that, a study on SaaS adoption in Southeast Asia found that lengthy setup times are a major growth killer. Multi-tool stacks can take 4-6 weeks to integrate, causing a staggering 59% of founders to abandon their expansion plans. HappyPanda’s 10-minute setup via a single script tag gets rid of this friction, boosting funnel completion by 40% in our pilot tests.
Finally, after you’ve implemented a fix, you need to tell your users about it. An integrated platform helps you close the loop with features like changelogs and “What’s New” widgets. This ensures that the users who reported the problem know you listened and took action, which goes a long way in rebuilding trust and improving retention. By centralising these functions, you create a seamless workflow for your entire analysis of root cause, from the initial discovery to the final resolution.
A Few Common Questions About Root Cause Analysis
Even with a solid game plan, diving into root cause analysis can feel a bit like trying to solve a puzzle in the dark. A few common questions always pop up, especially for busy SaaS founders. Nailing these fundamentals is the key to making RCA a sustainable, high-impact part of your workflow. Let’s clear up some of the usual suspects.
How Often Should We Bother with an RCA?
A lot of teams treat root cause analysis like a fire extinguisher—something you only grab during a full-blown crisis, like a server outage or a terrifying churn spike. And while it’s absolutely essential for those “all hands on deck” moments, its real power comes when you make it a regular habit.
Think of it less like an emergency procedure and more like a routine health check-up. You should kick off a formal RCA whenever a key metric suddenly goes off-piste or when you spot the same user complaint popping up again and again. This flips RCA from a reactive chore into a powerful engine for constantly making your product better.
A great root cause analysis isn’t just for putting out fires; it’s for fireproofing your entire product. By making it a regular practice, you solve small issues before they grow into company-threatening problems.
This proactive approach helps you build a more resilient and user-centric product over time. No more nasty surprises.
What’s the Difference Between a Contributing Factor and a Root Cause?
This is a big one, and it’s where many teams get tripped up. Think of a contributing factor as an accomplice—it helped the problem happen, but it wasn’t the mastermind. The root cause, on the other hand, is the real culprit. Fix that, and the problem vanishes for good.
Let’s say you find a puddle on your kitchen floor.
- Symptom: The puddle. Obvious, and annoying.
- Contributing Factors: The floor is slightly sloped, so the water gathered in one spot. The mop was hiding in a different room, delaying the clean-up.
- Root Cause: A leaky pipe under the sink.
You could level the floor or move the mop closer, and that might make the next spill less of a headache. But it won’t stop the spills. Only fixing that leaky pipe—the root cause—solves the problem permanently. In the SaaS world, a confusing UI might be a contributing factor to churn, but the root cause could be a flawed user research process that let that bad design get built in the first place.
Can We Do RCA with a Small User Base?
Absolutely. In fact, it’s often more powerful. When you have thousands of users, you’re usually squinting at quantitative data, looking for trends. With a smaller user base, you have a secret weapon: you can build real relationships and lean heavily into qualitative feedback.
Every piece of feedback is gold when you’re small. A few in-depth user interviews or a handful of detailed survey responses can reveal insights that would get totally lost in a sea of data. You don’t need statistical significance; you need the significance of the story. A single customer’s detailed complaint can shine a spotlight on a root cause that’s quietly frustrating everyone.
For small teams, the trick is to be surgical. Use tools to gather feedback at specific friction points, and don’t be afraid to just pick up the phone (or send a personal email). One honest chat can be worth more than a thousand data points when you’re starting out.
Stop juggling a dozen tools to understand your customers. HappyPanda brings your surveys, emails, onboarding, and changelogs into one simple, powerful platform. Get started for free and find your root causes faster.