
So, what actually is a good NPS score?
The short answer is anything above 0 is good, a score over 30 is great, and if you hit 70 or more, you’re in world-class territory. But let’s be honest, that’s just the starting line. The real measure of a “good” score depends entirely on your industry and what your competitors are doing.
Defining a Good Net Promoter Score

It’s tempting to chase a universal magic number, but the true power of your Net Promoter Score comes from context. Think of it less like a final grade in school and more like your position in a race. A score of +25 might be perfectly average in one industry but could make you a market leader in another where customer expectations are completely different.
This is where relative benchmarking becomes your best friend. Instead of just staring at your own number, the smartest way to see how you’re really doing is to measure your score against your direct competitors. This is especially true in the dynamic markets of Southeast Asia, where cultural nuances can seriously sway customer ratings.
Understanding the NPS Spectrum
To make sense of it all, it helps to break scores down into general performance levels. While industry specifics are what truly matter, this gives you a quick compass to figure out where you stand.
Here’s a quick reference to see where your score fits in at a glance.
General NPS Score Benchmarks
| NPS Score Range | Performance Level | What It Means |
|---|---|---|
| Below 0 | Needs Improvement | You’ve got more Detractors than Promoters. It’s a red flag telling you to fix some core customer issues—pronto. |
| 0 to 30 | Good | You have more fans than critics, which is a solid foundation. You’re on the right track, but there’s room to grow. |
| 30 to 70 | Great | You’re delivering an excellent experience and building strong customer loyalty. Keep it up! |
| Above 70 | World-Class | This is reserved for the most beloved brands. Your customers are true fans who drive word-of-mouth marketing. |
Ultimately, the goal is always continuous improvement—getting better than you were yesterday and staying ahead of the competition.
And remember, while NPS is a fantastic measure of loyalty, it’s just one piece of the puzzle. Understanding the differences between CSAT and NPS will give you a much more complete picture of your customer relationships.
How to Calculate Your Net Promoter Score
Before you can figure out if your NPS score is any good, you first have to get your head around how the number is actually calculated. Thankfully, it’s refreshingly straightforward.
It all kicks off by asking your customers one simple, yet incredibly powerful, question: “How likely are you to recommend our company/product/service to a friend or colleague?”
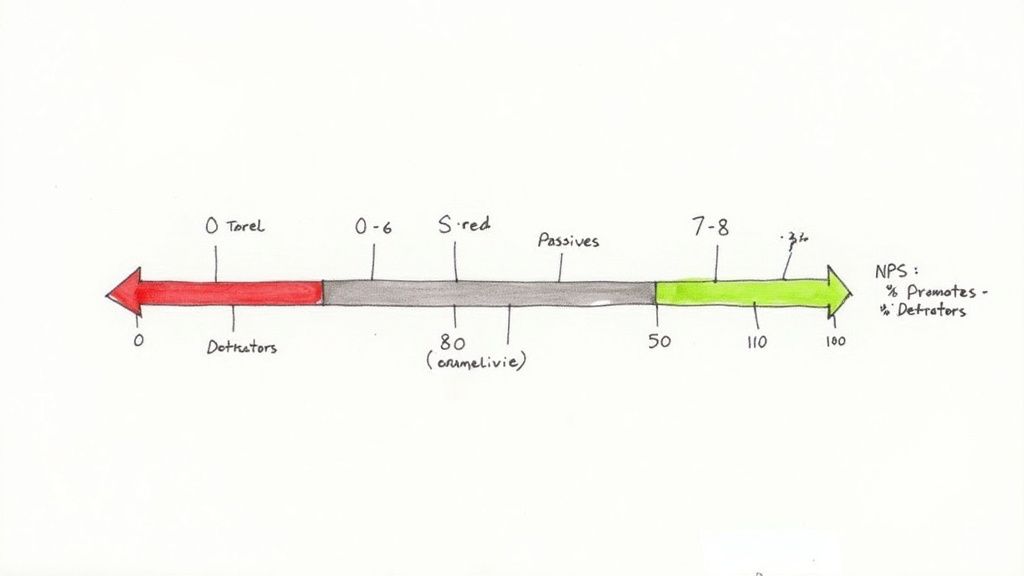
They’ll give you an answer on a scale from 0 (very unlikely) to 10 (very likely). Based on their response, every customer gets sorted into one of three distinct groups.
Segmenting Your Customers by Score
Getting to know these three groups is the key to unlocking what your final score really means. Each one represents a totally different level of customer loyalty and tells a unique story about your business’s health.
-
Promoters (Scores 9-10): These are your biggest fans. Your champions. They’re the ones singing your praises, driving word-of-mouth referrals, and basically acting as a volunteer marketing team.
-
Passives (Scores 7-8): This lot is satisfied, but don’t mistake that for loyalty. They’re happy enough for now, but they aren’t going out of their way to recommend you and could easily be tempted away by a competitor’s shiny new offer.
-
Detractors (Scores 0-6): And here we have the unhappy campers. These are the folks who’ve had a bad experience and, at best, are a serious churn risk. At worst? They’re actively damaging your brand with negative reviews and bad-mouthing.
The whole idea behind NPS is that not all customers are created equal. Promoters are your growth engine, while Detractors can put a serious dent in your reputation. That makes the balance between them a vital sign for your business.
The Simple NPS Formula
Right, once the survey responses are in, calculating your score is a simple two-step process. This isn’t about finding an average; instead, you’re just focusing on the two extremes—your happiest and unhappiest customers.
- First, figure out what percentage of your total respondents are Promoters.
- Next, do the same for your Detractors.
Then, you just subtract the percentage of Detractors from the percentage of Promoters. The Passives? They’re intentionally left out of the final calculation, though their feedback is still pure gold for making improvements.
NPS Formula: % Promoters - % Detractors = Net Promoter Score
Let’s make this real. Imagine you survey 100 customers. The results come back with 60 Promoters (60%), 25 Passives (25%), and 15 Detractors (15%).
Your calculation is simply: 60% (Promoters) - 15% (Detractors) = +45.
So, your Net Promoter Score is +45. Think of this number as a quick loyalty balance sheet, giving you an immediate snapshot of where you stand with your customers. Of course, getting this data in the first place hinges on using the right NPS question format, so make sure that’s dialled in.
Why a Good NPS Score Is Your Growth Engine
A good Net Promoter Score is way more than just a number to show off in a meeting; it’s a genuine predictor of your company’s future growth. Think of it less like a report card and more like the RPM gauge on your business’s engine. A high score tells you that your engine is humming along nicely, building the kind of momentum that leads to real business results.
When you have more Promoters than Detractors, you’re essentially unlocking a powerful, organic growth channel. These happy customers become a volunteer marketing army, spreading positive word-of-mouth that brings in highly qualified referrals at almost no cost. They’re also far more likely to stick around, which means less customer churn and better retention.
The Financial Kickback of Customer Loyalty
Pouring effort into your customer experience to improve NPS isn’t just about making people feel good; it’s one of the smartest, most cost-effective growth strategies out there. Loyal customers—your Promoters—simply spend more over their lifetime. It’s no surprise that a good NPS score is tied directly to customer loyalty, which is crucial for figuring out how to increase customer lifetime value in a SaaS business.
This direct link between satisfaction and revenue really shines a light on the financial power of a strong score.
- Slashed Churn: Happy customers don’t have a reason to leave. A mere 5% bump in customer retention can boost your profitability by anywhere from 25% to 95%.
- Cheaper Customer Acquisition: Referrals from your Promoters are gold. They convert at a much higher rate than leads you get from cold outreach.
- Easier Upsells: Loyal customers already trust you. That makes them far more open to trying new features or upgrading their plan when the time is right.
On the flip side, Detractors are actively working against your growth. They drive up churn, drain your support team’s resources, and can seriously tarnish your brand’s reputation with bad reviews and negative word-of-mouth. They create friction that slows you down.
Turning Feedback into Smarter Business Moves
Beyond just predicting growth, your NPS score is a vital tool for making better, more informed decisions. By tracking it over time, you can see the direct impact of your actions. Did that shiny new feature you launched actually delight customers, or did it just cause headaches? Your NPS trend will give you the unfiltered truth.
By digging into the why behind the score—the qualitative feedback that people leave—you can pinpoint exactly what you need to fix or where you should double down. This turns vague customer feelings into a clear, actionable roadmap for improving everything from your product to your support, making sure your business is always pointed in the right direction.
Understanding NPS Benchmarks in Southeast Asia
So, what’s a good NPS score? The honest answer is… it’s complicated. Especially when you’re operating in a region as culturally vibrant and diverse as Southeast Asia. A score that would have you popping champagne in New York might just be considered ‘average’ in Jakarta or Manila. Why? Because customer feedback is deeply tangled up in local market dynamics and cultural norms.
Chasing a global, “world-class” score of 70+ can be a wild goose chase for businesses here. It’s often a misleading and pretty demotivating goal. The real game isn’t about hitting some universal number; it’s about outperforming your direct, local competitors. Success is all relative, and in this part of the world, context is everything.
Why Southeast Asian Feedback Hits Different
In many Southeast Asian markets, you’ll find customer responses are a lot more polarised than what you’d see in Western countries. When an experience is bad, customers are often incredibly vocal and critical, which can send your Detractor scores through the floor. On the flip side, cultural tendencies can sometimes make people more reserved with high praise, leading to fewer Promoters even when they’re perfectly happy.
This creates a really unique landscape where even a positive NPS score is a massive win. Research from the Qualtrics XM Institute highlights these stark differences. It shows that when consumers in Malaysia dislike a company, Detractor rates can plummet to a staggering -88, a far cry from the milder -40 you might see in the US. A single negative experience can pack a much bigger punch.
What this all means is that a “good” NPS in Southeast Asia has to be graded on a curve. The true measure of success is simply matching or beating the scores of your regional competitors. If you want to dive deeper into these nuances, you can read the full research on calibrating NPS across 18 countries.
Setting realistic, regionally-aware targets is crucial. A score of +20 in a market known for harsh feedback might actually signal stronger customer loyalty than a +40 in a less critical one.
This flowchart breaks down what a strong, locally-benchmarked NPS score really drives.
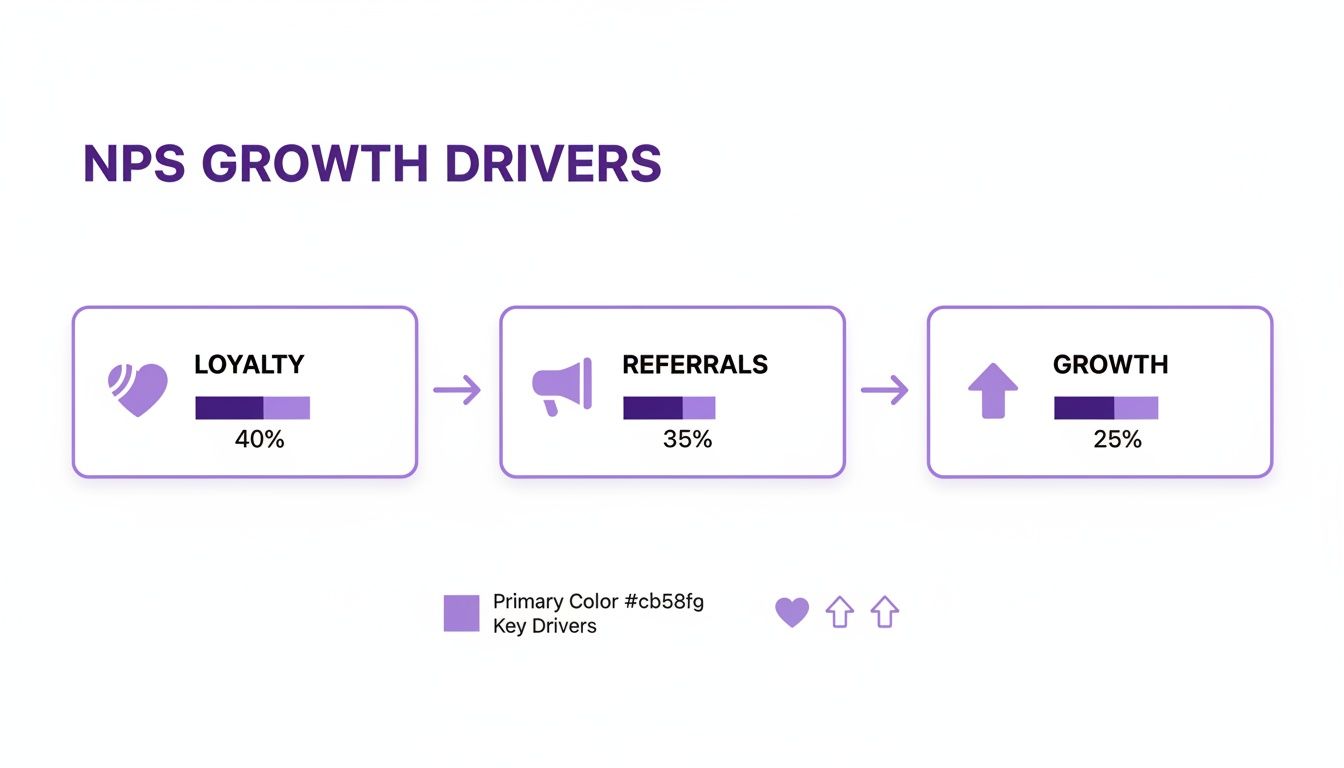
At the end of the day, it’s about building loyalty and getting people to recommend you. That’s how a good NPS score translates into actual business growth.
Setting Realistic Local Targets
Instead of getting hung up on a global ideal, it’s far better to take a more practical approach to setting your NPS goals in Southeast Asia. Your main objective should be simple: get better over time and stay ahead of the local pack.
Here’s how to think about it:
- Benchmark Against Local Competitors: First things first, find out the NPS scores of the key players in your specific country. Your goal is to be better than them. Simple as that.
- Track Your Own Progress: Honestly, the most important benchmark is your own past performance. Are you improving? Aim for steady, incremental growth quarter after quarter.
- Analyse the Qualitative Feedback: Don’t just look at the numbers. Dig into the why behind the scores. Understanding the cultural context of customer comments is where the real gold is for making meaningful improvements.
By adopting this localised view, you can set motivating, achievable targets that actually reflect the reality of your market and drive real progress.
Of course. Here is the rewritten section, crafted to sound like an experienced human expert and match the provided examples.
Real World NPS Examples from Southeast Asian Leaders
Benchmarks and theories are great, but let’s be honest—nothing makes a concept click like seeing it in the wild. When we look at how real companies are faring in the hyper-competitive Southeast Asian market, the whole idea of a “good” NPS score suddenly gets a lot clearer.
What you’ll find is that an “excellent” score is completely tied to the industry’s intensity and what customers in a specific country have come to expect. A number that makes you a market leader in one place might just be painfully average in another.
Let’s dive into the mobile telecommunications sector—a true battleground. In an environment where switching providers is just a few taps away, pulling off any positive NPS score is a serious win. Take Globe in the Philippines, for instance. A score of +10 might not sound earth-shattering, but in that market, it’s a strong signal of customer loyalty.
This is especially true when you realise that over half of the main mobile operators in the emerging Asia-Pacific region actually scored below zero. Ouch.
Benchmarks in the Mobile Telecom Arena
The sheer variability across the region is what really drives the point home: a good NPS is a moving target. Data from a wide-ranging consumer survey paints a vivid picture of this diversity.
- In Vietnam, Viettel hit an impressive +27, flexing its market dominance in a country where all the major players scored above +20.
- Over in Indonesia, Telkomsel landed a solid +11, positioning itself as the one to beat.
- Meanwhile, Thailand’s AIS reached +5, a perfectly respectable score in a crowded field.
- Then there’s Malaysia, where even the market leader, Digi, posted a -3. This shows just how brutal competition can get, dragging down scores for everyone.
The numbers don’t lie. In many of these markets, simply keeping your head above water (i.e., scoring above zero) is an achievement.
To give you a clearer view, here’s a quick snapshot of how scores can differ from one country to the next.
NPS Score Examples in SE Asia Mobile Telecom
This table compares NPS scores for leading mobile operators across different Southeast Asian countries, highlighting just how much the market environment matters.
| Country | Leading Operator | NPS Score |
|---|---|---|
| Vietnam | Viettel | +27 |
| Indonesia | Telkomsel | +11 |
| Philippines | Globe | +10 |
| Thailand | AIS | +5 |
| Malaysia | Digi | -3 |
As you can see, what’s considered a strong performance is all relative. For a closer look at the data, you can discover more insights about EMAP customer satisfaction. Understanding this context is crucial—it stops you from chasing some pie-in-the-sky global average and gets you focused on what really matters: outperforming your local rivals.
The key takeaway is this: a “good” NPS isn’t some fixed number on a chart. It’s a direct reflection of how you stack up against your competitors, right where you operate. It’s proof you’re delivering a better experience where it counts the most.
Lessons from SME Banking Leaders
The small and medium-sized enterprise (SME) banking sector tells a similar story, but with a different twist. In this space, a “good” NPS is often sky-high, driven by relationships built on trust. It’s not uncommon for leading banks in the region to achieve scores that are 1.2x to 2.25x higher than their peers.
How do they pull it off? Simple. They stop thinking like a transactional service and start acting like a genuine partner to their business clients. This hands-on approach directly translates into fierce loyalty, lower churn, and real, tangible growth. It’s the ultimate proof of the powerful link between a stellar NPS score and long-term success.
Actionable Strategies to Improve Your NPS Score
So, you’ve got your Net Promoter Score. That’s the easy part. The real work—and the real value—starts now. Knowing your score is one thing; using it to make genuine improvements is where the magic happens. It’s time to shift from just collecting numbers to actively creating better experiences for your customers.
The most powerful idea you need to embrace is closing the feedback loop. It’s a beautifully simple concept: listen to what your customers are saying, act on their feedback, and—this is the crucial bit—tell them you made a change because of them. This single act shows you’re not just harvesting data for a spreadsheet; you’re actually listening.
When you do this, feedback transforms from a static metric into an engine for growth. By methodically fixing what frustrates people and doubling down on what delights them, you can start turning Detractors into Passives, and Passives into die-hard Promoters.
Pinpoint and Prioritise Feedback
First things first, you need to dive into the comments. The score tells you what, but the qualitative feedback tells you why. This is where the gold is buried. Look for recurring themes and patterns from both your biggest fans and your toughest critics.
- For Detractors: What are the most common complaints? Is it a buggy feature that keeps crashing? A support response time that feels like an eternity? Or pricing that’s as clear as mud?
- For Promoters: What exactly do they love? Is it your ridiculously smooth onboarding process, that one feature they can’t live without, or the time your customer service team went above and beyond?
Once you’ve got these insights, it’s time to prioritise. Zero in on the issues that have the biggest impact on your customer experience. Fixing a widespread problem that’s creating Detractors should shoot straight to the top of your to-do list. You can learn more about structuring this process in our guide to closing the feedback loop.
A 2025 NPS Prism report on SME banking in Southeast Asia found a direct link between customer impact and loyalty. Financial Service Providers that delivered a “very much improved” quality of life saw their NPS soar to 79%—a full 20 points higher than those offering only “somewhat improved” outcomes. It proves that real, tangible benefits are what create true promoters.
Empower and Communicate Changes
With your priorities locked in, it’s time to take action. Give your frontline teams the power to solve common issues right on the spot. A support agent who can fix a problem immediately creates a memorable, positive moment that can completely turn a Detractor’s experience around.
For bigger issues that need product or policy changes, map out a clear action plan. And once you’ve rolled out an improvement, shout about it! Communicate the change back to the very customers who suggested it. A simple email saying, “You asked, we listened,” is incredibly powerful for building loyalty.
Think beyond just the NPS survey, too. Strategies like mastering personalization in email marketing also play a huge role in boosting overall customer satisfaction, which is a key driver for your NPS. It all works together to show you’re committed to a better experience at every single touchpoint.
Right, you’ve got the basics down, but as you start putting Net Promoter Score into practice, a few questions are bound to pop up. This is where the theory meets reality.
Think of this as your quick-fire guide to the practical side of running an NPS programme. We’ll tackle the common head-scratchers so you can move forward with confidence.
How Often Should We Send an NPS Survey?
This is one of the most common questions, and the honest answer is: it depends. There’s no single magic number here. The right timing hinges entirely on what you’re trying to learn.
If you’re measuring overall customer loyalty (relational NPS), you don’t want to bombard people. Sending a survey quarterly or even every six months is usually the sweet spot. It gives you a regular pulse check on your customer relationships without driving everyone mad with constant requests.
But if you’re after feedback on a specific event, like a support call or a new purchase (transactional NPS), you need to act fast. Send the survey immediately while the experience is still fresh in their mind. Waiting even a day can blur the details.
Is NPS Reliable with a Small Number of Responses?
It’s a valid concern. While every bit of feedback has value, a larger sample size will always give you a more stable, statistically sound score. With just a handful of responses, one really happy or really grumpy customer can swing your score dramatically.
But if you have a small customer base, don’t get hung up on the number itself. The real gold is in the trends. Is your score generally heading up or down over time? Even more importantly, dive into the comments. The qualitative feedback is where you’ll find the recurring themes and actionable ideas, and that’s true whether you have 10 responses or 10,000.
A single NPS score from a small sample is just a snapshot. The trend over several months is the story. Prioritise the narrative your customers are writing in the comments over a number that jumps around.
What Is the Difference Between NPS and CSAT?
It’s easy to mix these two up, but they’re measuring fundamentally different things. Getting the distinction right is crucial for using them properly.
-
CSAT (Customer Satisfaction Score) is all about the here and now. It measures short-term happiness with a specific, recent interaction—think “How was your support call today?” or “How was the checkout process?”
-
NPS, on the other hand, zooms out to look at the big picture. It gauges long-term loyalty and the overall health of your customer relationship, telling you how likely they are to stick around and recommend you to others.
Simply put: use CSAT to find and fix immediate friction points. Use NPS to understand and forecast customer loyalty, retention, and growth. They’re a brilliant duo when you use them together.
Ready to turn customer feedback into your biggest growth driver? HappyPanda combines NPS, CSAT, email sequences, and onboarding checklists into one simple platform. Start your free trial at https://happypanda.ai and see what your customers are really thinking.