
So, what exactly is a Key Performance Indicator, or KPI? Think of it as a crucial navigation tool, the kind that tells you if your SaaS business is actually heading in the right direction or if you’ve taken a wrong turn somewhere. It’s a measurable value that shows, in black and white, how effectively you’re hitting your most important business goals.
Understanding Your Business Dashboard
Imagine you’re piloting a small plane. The cockpit is crammed with dials, gauges, and flashing lights. Each one is a metric, spitting out some piece of data—cabin temperature, coffee cups served, the precise angle of the wing flaps. While all that information is available, you wouldn’t use it to navigate through a storm.
Instead, you’d zero in on a handful of critical instruments: your altitude, airspeed, fuel level, and compass heading. These are your KPIs. They’re the vital signs that tell you everything you need to know about the health and progress of your flight, letting you make smart decisions on the fly. For a bootstrapped SaaS founder, your business dashboard works exactly the same way.
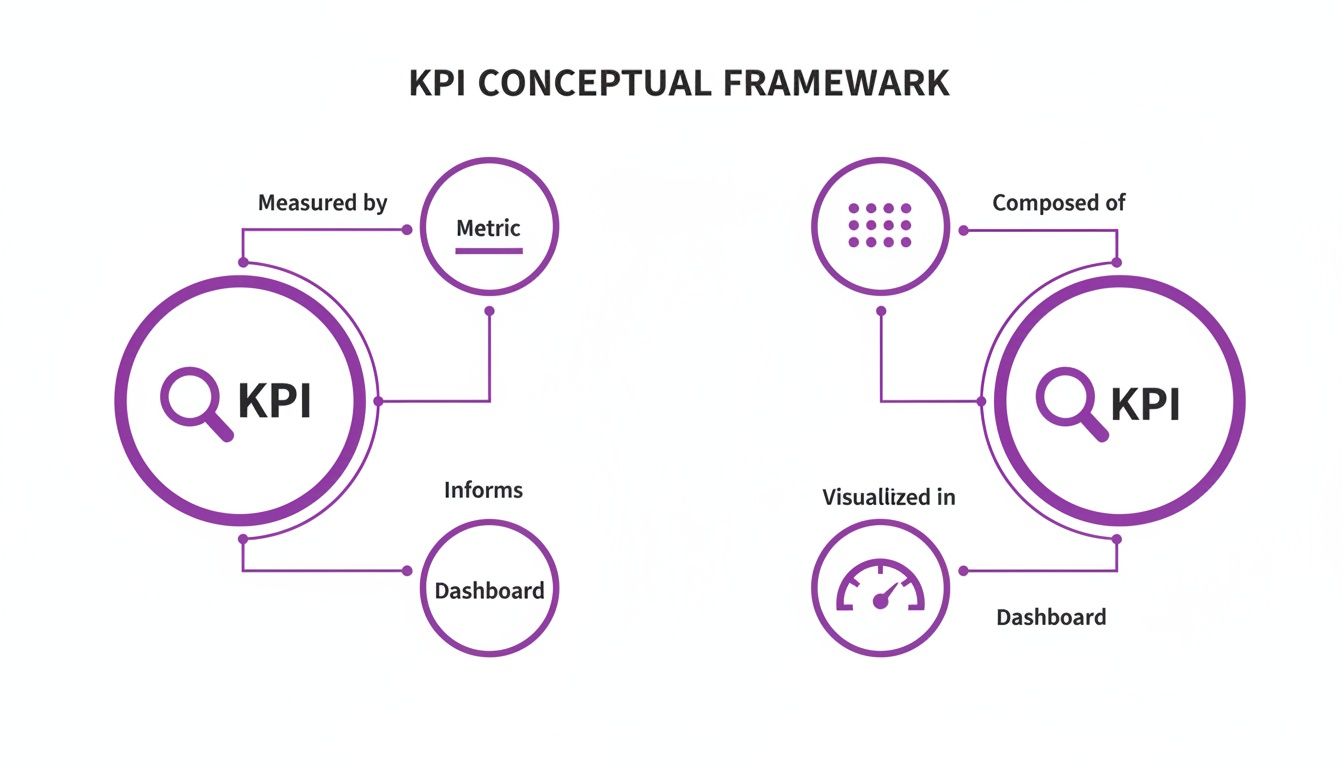
The Difference Between a Metric and a KPI
This is where a lot of people get tripped up. Every KPI is a metric, but not every metric earns the title of a Key Performance Indicator. Getting this distinction right is vital if you want to avoid drowning in data and focus your limited resources where they’ll make a real impact.
-
Metric: A metric is any quantifiable measure. It simply tracks activity. Things like total website visits, the number of sign-ups, or your social media follower count fall into this bucket. They’re your “nice-to-know” numbers.
-
Key Performance Indicator (KPI): A KPI, on the other hand, is a quantifiable measure that’s directly tied to a strategic business objective. It tracks outcomes and performance against a specific goal. We’re talking about heavy hitters like Customer Acquisition Cost (CAC), Monthly Recurring Revenue (MRR), or Customer Churn Rate.
A metric tells you what happened; a KPI tells you how you’re performing against your most important goals. For instance, 10,000 website visits is a metric. But knowing your website-visitor-to-trial-conversion-rate is 2% when your target is 3%—that’s a KPI. It connects an activity (people visiting your site) directly to a crucial business outcome (getting new users).
A classic mistake is to be drowning in data but starving for insight. The goal isn’t to track everything you possibly can; it’s to track the right things. A true KPI always has a clear purpose tied to a strategic decision you need to make.
Why KPIs Are Your SaaS Compass
For any product-led SaaS, a well-chosen set of KPIs brings clarity and direction to the chaos. It’s what moves you from guesswork and gut feelings to making data-driven decisions that will define your company’s future. To see what this looks like in practice, it’s worth exploring different business intelligence dashboard examples to get a feel for how the pros visualise their data.
Ultimately, your dashboard should tell a story. It needs to highlight your wins, expose your weaknesses, and guide your next move. By separating the vital few KPIs from the trivial many metrics, you transform your data from a noisy distraction into your most trusted co-pilot for navigating the path to sustainable growth.
Right, let’s talk about how to make sense of all this data. Tracking every single metric is a recipe for disaster—it’s like trying to listen to every conversation at a crowded party. You won’t hear anything useful.
A smart SaaS founder doesn’t just collect numbers; they group them into categories that tell a story. Think of it like a doctor checking your vitals. They don’t just take your temperature; they check your heart rate and blood pressure too. Each one tells them something different, but together they give a complete picture of your health. The same goes for your business.
To really get a handle on your company’s performance, you need to organise your KPIs into a few key buckets. These categories usually follow the customer’s journey, from the moment they hand over their credit card details to the point where they can’t imagine life without your product. This turns a messy spreadsheet into a clear roadmap, showing you exactly where you’re winning and where you’re stalling.
The diagram below breaks down how this works. You start with broad metrics, distill them into focused KPIs, and then display them on a dashboard for a clean, strategic view.
To make this crystal clear, we’ve broken down the essential KPI categories and what each one really tells you about your business.
SaaS KPI Categories and the Questions They Answer
| KPI Category | What It Measures | Key Question It Answers |
|---|---|---|
| Revenue | The direct financial health and profitability of your SaaS. | ”Are we making any money?” |
| Activation & Engagement | How much value users are finding in your product. | ”Do people actually use our product?” |
| Retention | Your ability to keep customers around long-term. | ”Are our customers sticking with us?” |
| Customer Success | Overall user happiness and satisfaction. | ”Do our customers love us (and why)?” |
Each category provides a different lens through which to view your company’s health, and together they create a powerful, multi-dimensional picture of your growth engine.
Revenue KPIs
Let’s start with the most obvious one: the money. Revenue KPIs are all about the financial lifeblood of your company. These are the metrics that tell you if you’re building a business or just an expensive hobby.
Numbers like Monthly Recurring Revenue (MRR) and Average Revenue Per User (ARPU) give you an undeniable snapshot of your bottom line. They cut through the noise and answer the most fundamental question: “Is what we’re doing profitable?”
Activation and Engagement KPIs
This is where things get interesting, especially for product-led companies. Activation and Engagement KPIs measure whether users are actually experiencing that “aha moment”—the point where they truly understand the value your product offers.
Strong activation is a massive leading indicator of future revenue. After all, if people sign up but never use your key features or build habits around your product, they’re not going to stick around for long, let alone pay you. This is how you measure your product’s stickiness.
For a SaaS business, acquisition without activation is just a leaky bucket. You can pour users in all day, but if they don’t find value and engage, they’ll drain out just as quickly.
Retention KPIs
So, you’ve got users activated. Brilliant. Now, can you keep them? Retention KPIs measure your ability to hold onto customers over time, which is absolutely critical for sustainable growth. We’ve all heard it: acquiring a new customer can be five times more expensive than keeping an existing one.
This category is home to heavy-hitters like Customer Churn Rate and Customer Lifetime Value (LTV). A low churn rate and a high LTV are the hallmarks of a healthy product that delivers real, consistent value and builds a loyal customer base.
Customer Success KPIs
Finally, we have the “feels” category. Customer Success KPIs measure happiness and satisfaction. While some might dismiss these as “soft” metrics, they provide the crucial “why” behind all your other numbers.
A dropping Net Promoter Score (NPS), for example, can be an early warning flare for future churn. By keeping an eye on Customer Satisfaction (CSAT) scores, you get direct feedback on the user experience. These metrics ensure you’re not just growing, but building a business that people genuinely love.
Essential KPIs Every Founder Should Track
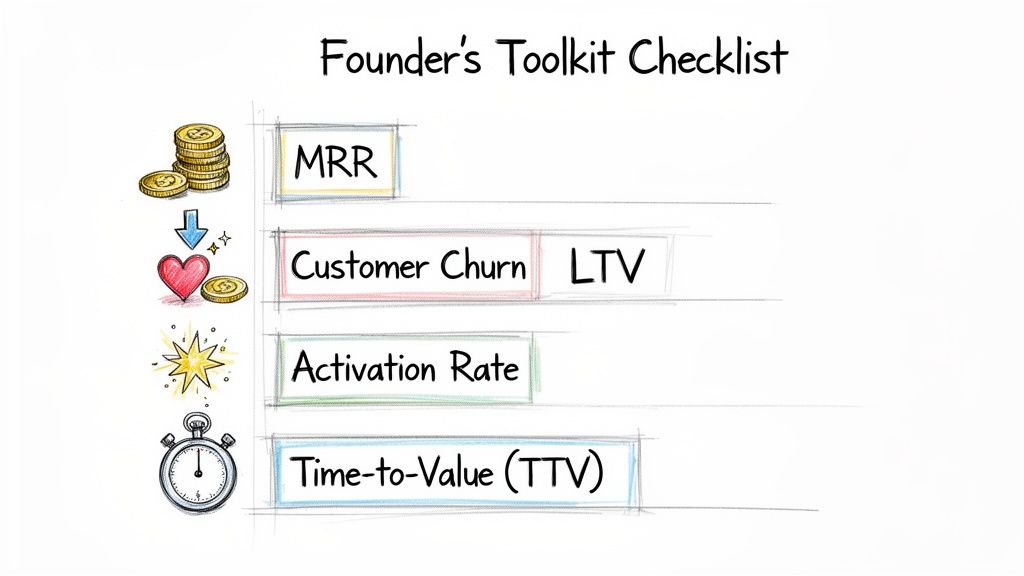
Alright, we’ve covered the theory. Now, let’s get our hands dirty. It’s one thing to know what KPI categories are, but it’s another thing entirely to know which specific metrics to pull onto your dashboard and watch like a hawk.
Think of this next part as your practical toolkit—the absolute must-track KPIs for any SaaS founder who’s serious about growth. We’ll break down what each one actually means, give you the back-of-the-napkin formula, and translate the numbers into a story about your business’s health.
This isn’t just about spreadsheets and charts. It’s about learning to read the tea leaves of your business, spotting problems before they spiral, and uncovering opportunities hiding in plain sight.
Measuring Your Financial Health
First up, the money. These revenue KPIs are the bedrock of your business. They offer an unfiltered look at your financial pulse and answer the million-dollar question: are you actually building a sustainable company?
1. Monthly Recurring Revenue (MRR)
This is the king of all SaaS metrics. Your MRR is the predictable, reliable income you can count on hitting your bank account every single month. It’s the heartbeat of your subscription model and the clearest sign of your financial momentum.
- How to Calculate It: Simply add up all the recurring revenue you’ve billed for the month.
- What It Tells You: Is the number going up? Great, you’re growing. Is it flat or, worse, dipping? That’s a red flag. It’s your earliest warning that you have a churn or acquisition problem that needs immediate attention.
2. Customer Churn Rate
Churn is the silent killer. It’s the percentage of customers who hit the cancel button and walk away. A seemingly tiny monthly churn can snowball into a massive problem over a year, undermining all your hard work.
- How to Calculate It: (Customers Lost in Period / Customers at Start of Period) x 100
- What It Tells You: High churn screams that something is wrong. It could be your product, your pricing, or your customer service. It’s a direct measure of how well you’re holding onto the customers you fought so hard to win.
For an early-stage SaaS, keeping monthly churn below 5% is a decent goal. As you find your footing, pushing that down to 1-2% is the mark of a seriously sticky product that customers can’t live without.
Gauging Product Stickiness
Financials tell you what already happened. Activation and engagement metrics, on the other hand, are like a crystal ball. They give you a glimpse into the future by showing whether users are actually getting value from your product right now.
3. Activation Rate
Activation is that magic “aha moment” when a new user truly understands your product’s value. This KPI tracks how many of your new sign-ups actually reach that point by completing a crucial first step.
- How to Calculate It: (Number of Users Who Completed Key Action / Total New Users) x 100
- What It Tells You: A low activation rate is a flashing neon sign that your onboarding is broken. People are showing up to the party but leaving before the music starts. They’ll almost certainly churn.
4. Time to Value (TTV)
How long does it take for a new user to have that “aha moment”? That’s your TTV. The faster, the better. When users find value quickly, they’re far more likely to stick around for the long haul.
- How to Calculate It: Measure the average time from the moment a user signs up to when they complete that key activation event.
- What It Tells You: A long TTV means your onboarding is too complicated, confusing, or just plain boring. Shortening that journey can have a massive impact on keeping users engaged.
Understanding Long-Term Viability
Now, let’s zoom out. These next KPIs give you a strategic, 30,000-foot view of your business model. They help you figure out if the relationship between what you spend to get a customer and what they’re worth to you is sustainable.
5. Customer Lifetime Value (LTV)
Your LTV is a prediction of the total amount of money you can expect to make from a single customer over their entire time with you. It puts your monthly revenue into perspective by showing the true, long-term worth of each new sign-up.
- How to Calculate It: (Average Revenue Per User) / (Customer Churn Rate)
- What It Tells You: A healthy LTV means you’ve built something valuable that people are happy to pay for over time. This number is your North Star for deciding how much you can responsibly spend on sales and marketing.
6. Customer Acquisition Cost (CAC)
Your CAC is the total price tag for acquiring one new customer. This includes everything—from your Google Ads spend to the salaries of your sales and marketing folks. Without knowing this number, you’re flying blind on profitability.
- How to Calculate It: Total Sales & Marketing Spend in a Period / Number of New Customers Acquired in that Period
- What It Tells You: CAC tells you how efficient your growth engine is. The game is to keep this number as low as possible. For a SaaS business to survive, your LTV must be significantly higher than your CAC. The classic rule of thumb is to aim for an LTV:CAC ratio of at least 3:1.
Listening to the Voice of the Customer
Finally, numbers only tell half the story. To get the full picture, you have to actually listen to your customers. These KPIs measure sentiment, giving you the “why” behind the data and helping you understand what makes users happy (or not).
7. Net Promoter Score (NPS)
NPS boils down customer loyalty into one simple question: “How likely are you to recommend our product to a friend or colleague?” It sorts your users into Promoters (your fans), Passives (the indifferent), and Detractors (the unhappy ones), giving you a clear score for your word-of-mouth potential. If you’re keen to dig deeper, you can learn more about the differences between CSAT and NPS in our detailed guide.
- How to Calculate It: Percentage of Promoters - Percentage of Detractors
- What It Tells You: Your NPS is a direct pulse check on customer happiness and a powerful leading indicator of future growth or churn. It helps you identify your biggest fans for testimonials and your most at-risk users before they walk out the door.
Choosing the Right KPIs for Your Business Stage
Trying to track every KPI under the sun is a surefire recipe for overwhelm. It’s like trying to listen to every instrument in an orchestra at once—you just end up with noise. The sharpest founders know their KPI dashboard isn’t a static monument; it’s a living tool that has to evolve right alongside their company.
The metrics that matter when you’re a two-person team hunting for product-market fit are worlds away from what a scaling business needs to watch. This is where the idea of the ‘One Metric That Matters’ (OMTM) comes into play. It’s a framework for ruthless prioritisation, forcing you to zero in on the single KPI that will move the needle the most on your current goal.
KPIs for the Pre-Product-Market Fit Stage
Before you’ve got a product that a solid group of users absolutely loves, your universe should revolve around two things: activation and retention. At this early stage, throwing money at acquiring thousands of users is like trying to fill a leaky bucket with a firehose. It’s expensive, messy, and gets you nowhere.
Your main mission is to prove your product actually delivers value. So, your dashboard should be packed with metrics that measure how engaged and “sticky” your product is.
- Activation Rate: Are new users hitting those key “aha moments”? This tells you if your onboarding is doing its job.
- Weekly Active Users (WAU): A simple but potent signal that people are building a habit around your product.
- Feature Adoption Rate: Are people actually using the core features you bled for? If not, you either built the wrong thing or you’re doing a poor job of showing it to them.
- Qualitative Feedback: Right now, raw customer conversations and survey replies are worth their weight in gold—often more than any quantitative metric.
The goal isn’t growth at all costs; it’s learning. Every move you make should be aimed at improving these core engagement metrics to prove you’ve built something people genuinely want and need.
KPIs for the Scaling and Growth Stage
Once you’ve nailed product-market fit, the game completely changes. You’ve proven your core value, and now it’s time to hit the accelerator. Your focus shifts from just keeping users around to efficiently acquiring more of them and maximising what they’re worth over time.
This is when the financial and acquisition KPIs take centre stage. Your dashboard should now look like a business that’s building a proper, sustainable growth engine. You’ll still keep an eye on retention, but a new set of metrics becomes absolutely critical.
- Customer Lifetime Value (LTV): This is your north star for understanding the long-term profitability of your customers. You can get a head start by using a customer lifetime value calculator to play with different scenarios.
- Customer Acquisition Cost (CAC): How much are you shelling out for each new customer? Keeping this number from spiralling out of control is the key to profitable growth.
- LTV to CAC Ratio: The golden ratio of SaaS. A healthy business is typically aiming for a ratio of 3:1 or better.
- Expansion MRR: This is your secret weapon. It measures revenue growth from your existing customers through upgrades and add-ons. It’s the most efficient way to scale.
Adapting KPIs to Market Opportunities
Your choice of KPIs isn’t just an internal affair; you have to react to what’s happening in the market. For example, strong economic trends in a specific region could light up a massive growth opportunity and totally change which metrics you prioritise.
A perfect example is the recent boom in industrial activity across Southeast Asia, which saw manufacturing growth hit 4.1 percent. For a SaaS founder in the region, that’s not just some dry statistic; it’s a flashing green light. This kind of manufacturing confidence almost always leads to more business spending on software. It signals that it’s the perfect time to double down on acquisition KPIs and tailor your marketing to a booming sector. You can discover more insights about Southeast Asia’s economic landscape to help shape your strategy.
Right, let’s talk about the classic KPI blunders. It’s easy to get lost in a sea of numbers, and for bootstrapped founders, a wrong turn can cost you more than just time—it can send you chasing ghosts. Data is a brilliant tool, but only if you know how to read the map.
One of the biggest traps is mistaking vanity metrics for actionable metrics. A vanity metric is like a shot of ego—it feels amazing to announce you’ve hit 50,000 total signups, but what does that number actually tell you? Not much. An actionable metric, like a 35% user activation rate, tells a real story. It proves new users are actually sticking around and finding value, which is the bedrock of retention and revenue.
Chasing vanity metrics is like judging your health by your height. It’s a number, but it doesn’t tell you if you’re actually fit. Focus on the metrics that measure your business’s vital signs, not just its size.
Setting Unrealistic Targets
Here’s another classic: setting goals so high they’re basically science fiction. Ambition is great, but aiming for a key performance indicator that’s laughably out of reach is a fantastic way to kill team morale. When your team is constantly missing targets, motivation dies a slow death. The whole point of tracking KPIs is to inspire progress, not to remind everyone of what they can’t do.
It’s far better to start with realistic, incremental goals based on where you are right now. Consistently hitting and smashing achievable targets builds momentum and creates a culture of winning. You can always raise the bar later.
Ignoring the Story Behind the Numbers
Data tells you what is happening, but it rarely explains why. A sudden dip in your Net Promoter Score (NPS) is a flashing red light, but the number itself is useless without context. To get to the truth, you have to roll up your sleeves and dig into the qualitative stuff—the customer comments, the frustrated support tickets, and the user interviews.
Ignoring the human stories behind your data is a massive mistake. The real gold—the insights that spark brilliant product updates and life-saving pivots—is almost always hiding in the “why.” Always pair your quantitative KPIs with qualitative feedback. It’s the only way to see the full picture.
Misinterpreting Market Dynamics
Finally, you can’t just look at your numbers in a vacuum. A shallow grasp of your target market, especially when you’re expanding, can lead to some seriously flawed conclusions. For instance, launching a one-size-fits-all strategy for Southeast Asia is a recipe for failure. That market is anything but a monolith.
A recent assessment of regional influence across the 11 ASEAN nations found huge differences. Singapore showed a balanced influence, while the Philippines had unique socio-technological strengths. If you don’t understand these nuanced regional influence KPIs, you’re just guessing. To avoid costly mistakes and properly tailor your strategy, you can explore the full findings on regional market dynamics and get a much clearer view of the landscape.
Building Your KPI Dashboard with the Right Tools
Let’s be honest. Trying to wrangle data from a dozen different spreadsheets is a nightmare. It’s the kind of soul-crushing manual work that pulls you away from what you should be doing: building a better product and actually talking to your customers. This “spreadsheet chaos” isn’t just an operational headache; it’s a massive strategic blind spot.
When your performance data is scattered everywhere, you can never see the full picture. You end up trying to connect the dots between a CSV export from your email tool and a separate report from your survey software. This siloed approach makes it almost impossible to understand the customer journey as one continuous story.
The fix? Ditch the manual tracking and get a dedicated tool designed to bring all your data together. For any founder serious about making clear, data-driven decisions, this isn’t just a nice-to-have—it’s essential.
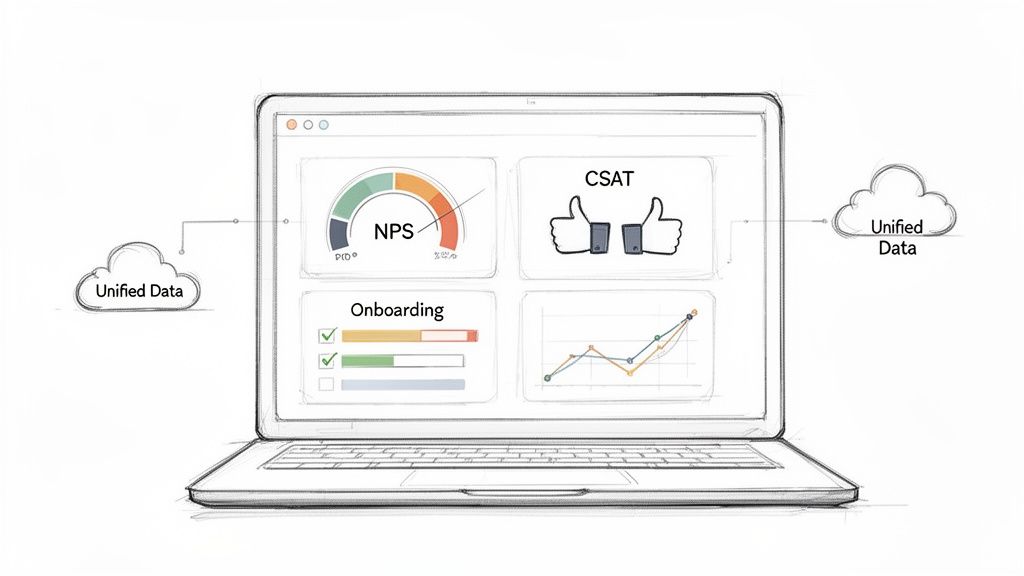
From Chaos to Clarity with Unified Platforms
Modern analytics and communication platforms are built to tear down data silos. Instead of burning hours exporting, formatting, and merging spreadsheets, you can have a single, automated dashboard that tells you a coherent story about your business. This is where KPIs truly come to life.
For instance, a unified platform can automatically track and connect customer-centric KPIs that are otherwise a pain to link. Imagine a world where you can instantly see:
- Customer Success Metrics: Track NPS and CSAT scores automatically, without needing to manually send out surveys.
- Activation Milestones: See exactly who completes your in-app onboarding checklist to measure true activation.
- Direct Feedback Loops: Instantly connect a high NPS score from a user to an automated request for a glowing testimonial.
This level of integration transforms your data from a pile of isolated numbers into a dynamic, interconnected system. You stop reacting to old data and start proactively shaping the customer experience.
A unified dashboard doesn’t just show you what happened; it reveals the connections between different KPIs. You can finally see how a smoother onboarding experience directly impacts your customer churn rate, all in one place.
The Power of a Single Source of Truth
The end goal is to create a single source of truth for all your customer data. When every metric lives under one roof, you get a clear, unobstructed view of the entire customer lifecycle. This unified perspective is crucial for understanding how different parts of your strategy actually influence each other. If you want to dig deeper, you can learn more about creating a single source of truth for your data and see how it sharpens your decision-making.
For bootstrapped founders, this isn’t a luxury; it’s a necessity. Platforms like HappyPanda are designed specifically to bring customer-centric KPIs together without needing expensive, complex integrations. This lets you monitor engagement, gather feedback, and measure satisfaction from one central command centre, giving you the clarity you need to grow your business without breaking the bank.
SaaS KPIs: Your Questions, Answered
Even with a solid plan, a few questions always pop up when you get down to the business of tracking KPIs. Here are some of the most common ones we hear from founders who are ready to drive growth.
How Many KPIs Should I Actually Track?
Honestly, less is more. It’s tempting to want to measure every single thing that moves, but the best leadership teams focus on fewer than 25 measures in total. If you’re a bootstrapped founder, zero in on 3-5 core KPIs at any given time. That’s it. This forces you to be ruthless about what really matters right now.
Trying to keep an eye on dozens of metrics at once is a surefire way to get lost in the noise. The goal here is clarity, not complexity.
How Often Should I Be Looking at My KPIs?
The right rhythm depends entirely on the metric you’re tracking. Not all KPIs move at the same speed.
- Weekly: This is for your early warning signs—things like Activation Rate and Weekly Active Users (WAU). These leading indicators tell you if user engagement is heading in the right direction long before revenue takes a hit.
- Monthly: Time to check your financial pulse. Metrics like Monthly Recurring Revenue (MRR) and Customer Churn give you a clear, honest picture of your momentum and financial health.
- Quarterly: Now you zoom out. Strategic, slow-moving KPIs like Customer Lifetime Value (LTV) and your LTV:CAC ratio come into focus here. They inform the big-picture decisions that shape the future of your company.
What’s a “Good” Benchmark for My KPIs?
This is the million-dollar question, and the blunt answer is: it depends. A 5% monthly churn rate might be perfectly fine for an early-stage B2C app finding its feet, but it would be a five-alarm fire for a mature B2B platform.
Instead of getting hung up on what other companies are doing, start by benchmarking against yourself. Your first and most important goal is to improve your own numbers, month after month. Once you’re growing consistently, then you can start peeking at how you stack up against similar companies.
The only benchmark that truly matters at first is your own past performance. Aim for steady, incremental wins instead of trying to match someone else’s highlight reel.
Can I Change My KPIs Over Time?
You absolutely can. In fact, you should. Your KPIs aren’t carved in stone; they’re meant to evolve right alongside your business.
A company that hasn’t hit product-market fit yet should be obsessing over retention and engagement. But once they’ve nailed that, the focus will naturally pivot to efficient acquisition and profitability metrics like LTV and CAC. Revisit your KPIs at least once a quarter to make sure they’re still aligned with your most critical business goals.
Trying to track every key performance indicator across the entire customer lifecycle—from NPS surveys to onboarding checklists—can feel like juggling chainsaws. HappyPanda brings all your customer communication and feedback into a single, affordable platform, giving you a crystal-clear dashboard without the spreadsheet chaos. Get started in 10 minutes at https://happypanda.ai.