
A customer lifetime value calculator is more than just a tool; it’s a window into the future health of your business. It takes key metrics about your customers and turns them into an estimate of the total revenue you can expect from them over their entire relationship. Think of it as a way to put a real number on customer loyalty, helping you make much smarter financial decisions.
What Is Customer Lifetime Value, Really?

Stop thinking about your customers as a string of one-off sales. Instead, picture them as a long-term investment portfolio. Some investments might give you a small, quick return, while others are the slow burners that grow steadily for years. Customer Lifetime Value (CLV) is the metric that tells you the total worth of each of those investments over their entire lifespan with your business.
This simple shift in perspective is a game-changer for sustainable growth. It moves your focus from chasing short-term sales targets to building lasting, profitable relationships. After all, we all know that bringing in a new customer costs a whole lot more than keeping an existing one happy.
Why CLV Is a Game-Changing Business Metric
When you truly get your head around CLV, it changes how you see almost every part of your business. It gives you a rock-solid financial reason to invest in customer experience and retention. No more guessing how much to spend on marketing or support; you can finally make data-driven decisions that directly boost your long-term profitability.
Knowing your CLV helps you pinpoint your most valuable customers, which lets you:
- Optimise Your Marketing Spend: Put your budget where it counts by targeting customers who look like they’ll have a high CLV, guaranteeing a better return.
- Prioritise Product Development: Focus your roadmap on features and tweaks that delight your best customer segments and keep them loyal.
- Refine Customer Service: Justify spending a bit more on supporting high-value customers to keep them from churning and turn them into advocates.
CLV isn’t just another number to track; it’s your strategic compass. It points your business towards sustainable growth by showing you who your best customers are and encouraging you to invest in keeping them around for the long haul.
To see just how CLV can steer your decisions across the board, take a look at the summary below.
Why CLV Is a Game-Changing Business Metric
| Business Area | Impact of High CLV | Strategic Decision-Making |
|---|---|---|
| Marketing & Acquisition | Higher ROI on ad spend | Focus budget on channels that attract high-value customers. |
| Product Development | Justifies investment in retention features | Prioritise roadmap items that increase customer satisfaction. |
| Customer Success | Enables premium support tiers | Allocate more resources to prevent churn in valuable segments. |
| Financial Planning | More predictable revenue forecasting | Build long-term growth models based on customer value, not just sales. |
This table really just scratches the surface, but it shows how CLV becomes the connecting thread between different departments, aligning everyone towards the same goal: long-term, profitable growth.
The Challenge of Customer Retention
The focus on CLV has become even more critical in today’s crowded markets, where customer loyalty is incredibly hard to win. In Southeast Asia, for instance, high churn rates and soaring acquisition costs have pushed retention to the top of everyone’s agenda. A landmark report found that up to 60% of new customers in the region are lost within just three months of their first purchase—a massive wake-up call for brands. You can get more details on these customer retention challenges over at marketingtnt.org.
This tough reality is exactly why a customer lifetime value calculator is no longer a “nice-to-have.” It’s an essential piece of kit. It gives you the clarity to see through the noise, move beyond superficial metrics, and understand the real financial impact of loyalty, helping you build a much more resilient business.
Getting Hands-On with Our CLV Calculator
Alright, enough theory. Understanding CLV is one thing, but plugging in your own numbers is where the magic really happens. That’s exactly why we built this interactive customer lifetime value calculator—to turn an abstract metric into a hard number you can start using today.
We’ve designed our tool to be flexible, with two different modes to fit your business like a glove. Whether you’re running an online shop or a global SaaS platform, you can get a meaningful result in minutes.
Choose Your Calculation Mode
First things first, you’ll need to pick the mode that best fits your business model. We’ve created two distinct paths to make sure the inputs are relevant to how you operate, giving you the most accurate result possible.
- Basic Mode: Perfect for e-commerce, retail, or any business where transactions are pretty straightforward. This mode gives you a quick, clear estimate using the fundamental metrics.
- Advanced Mode: Built specifically for SaaS and subscription-based businesses. It brings in crucial metrics like churn and gross margin, which are the lifeblood of recurring revenue models.
Whichever mode you choose, you’ll find helpful tooltips for each input field. These little guides explain exactly what data to grab and where you might find it, so the whole process is smooth and error-free.
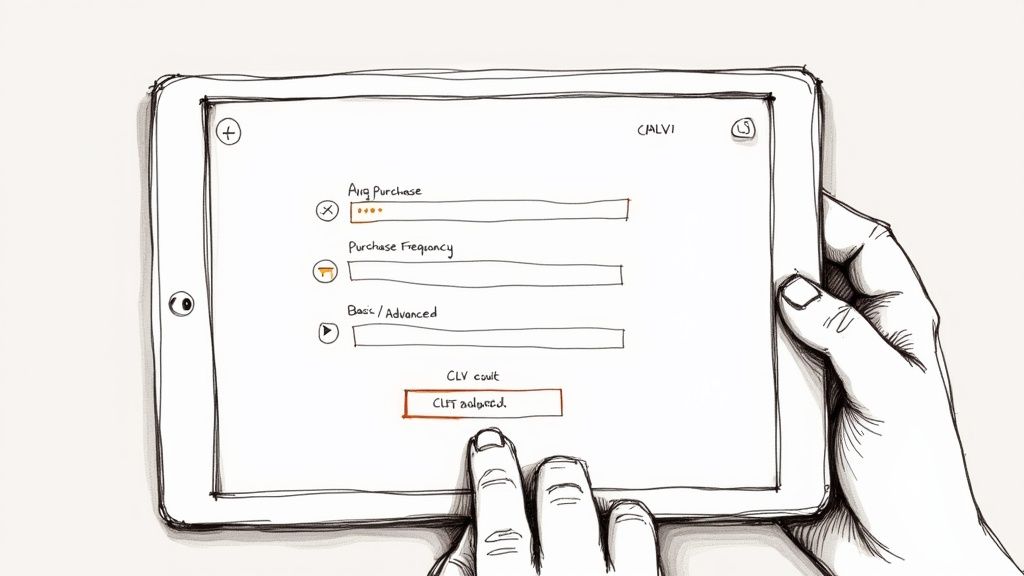
Basic Mode for a Quick Snapshot
The Basic mode is your fastest route to a solid CLV estimate. It’s built on three core inputs that get right to the heart of your customer relationships.
- Average Purchase Value: How much does a customer spend, on average, each time they buy from you?
- Average Purchase Frequency: How often does a typical customer come back to make a purchase in a given period (like a year)?
- Average Customer Lifespan: On average, how long does a customer stick around and keep buying from you?
Pop in these three figures, and our customer lifetime value calculator instantly crunches the numbers to give you an estimated CLV. It’s a powerful baseline that can kickstart some serious strategic conversations.
Advanced Mode for SaaS and Subscriptions
When your business is built on recurring revenue, the game changes. The Advanced mode is tailored for the unique rhythm of subscription models, delivering a much more precise calculation.
This mode isn’t about one-off sales; it’s about the ongoing value of a subscription. It factors in the financial realities of customer retention and the costs of service, which are absolutely central to the SaaS world.
Here are the key inputs you’ll need for the Advanced mode:
- Average Revenue Per Account (ARPA): The average revenue you generate per customer, typically on a monthly or annual basis.
- Gross Margin %: The percentage of revenue you have left after accounting for the direct costs of providing your service (COGS).
- Customer Churn Rate: The percentage of customers who cancel their subscriptions over a set period.
This approach gives SaaS founders and product managers a CLV that truly reflects the health of their subscription base. The final number helps you confidently weigh your customer acquisition costs against long-term profit. Just enter your data, and let the calculator handle the rest.
How the CLV Formulas Actually Work
A customer lifetime value calculator isn’t some black box spitting out random numbers. It’s an engine, and like any good engine, it runs on clear, logical formulas. Once you understand the mechanics, you’ll see exactly how the final number comes to life, giving you the confidence to trust it and, more importantly, act on it.
Let’s pop the bonnet and take a look at the two primary models that power our calculator. Each one is designed for a specific type of business, ensuring the inputs make sense and the output is genuinely useful for your planning.
The Simple CLV Formula: Perfect for E-commerce and Retail
For businesses built on distinct, individual sales—think a local bookshop or an online clothing boutique—the Simple CLV formula is a brilliant starting point. It multiplies three core ingredients to estimate the total revenue you can expect from a typical customer.
The formula is straightforward: Average Purchase Value x Purchase Frequency x Customer Lifespan
Let’s break that down with an example we can all relate to.
Imagine a loyal customer named Alex at a local bookshop:
- Average Purchase Value: Every time Alex pops in, they typically spend £30.
- Purchase Frequency: Being an avid reader, they visit about 10 times a year.
- Customer Lifespan: You figure a loyal customer like Alex sticks around for about 5 years.
Putting it all together, Alex’s simple CLV looks like this:
£30 (Value) x 10 (Frequency) x 5 (Lifespan) = £1,500
Suddenly, Alex isn’t just a £30 sale. They represent £1,500 in potential revenue over their entire relationship with your shop. This insight is massive, especially when you think about how much you spend to get new customers. In Southeast Asia, for instance, customer acquisition costs have tripled since 2013, with brands often losing an average of $29 on each new customer. That’s a harsh reality that makes knowing long-term value absolutely essential for survival.
The Predictive CLV Formula: Built for SaaS and Subscriptions
Subscription-based businesses, like SaaS platforms, march to a different beat. Customers bring in recurring revenue, but they can also “churn”—or cancel their service. The Predictive CLV formula is tailored specifically for this rhythm.
Here’s the formula: (ARPA x Gross Margin %) / Churn Rate
This approach switches the focus from one-off purchases to the ongoing value of a subscription. It bakes profitability and the very real risk of losing a customer right into the calculation, giving you a much sharper financial forecast for recurring revenue.
Let’s run the numbers for a hypothetical software company.
- Average Revenue Per Account (ARPA): On average, your customers pay £100 per month.
- Gross Margin %: After you pay for server costs and support staff directly tied to the service, you keep 80% of that revenue.
- Monthly Churn Rate: Each month, an average of 3% of your customers cancel their subscriptions.
First, we calculate the monthly profit per account: £100 (ARPA) x 80% (Gross Margin) = £80.
Now, we can plug that into the full formula:
£80 (Monthly Profit) / 3% (Churn Rate) = £2,667
This predictive figure tells us that the average subscriber is worth roughly £2,667 in gross profit over their lifetime. To really get into the weeds of this methodology, it’s worth checking out a comprehensive SaaS Customer Lifetime Value Calculation Guide.
Understanding these formulas shows you there’s no magic involved—it’s about seeing precisely how your inputs shape the final CLV. It’s not just about getting a number; it’s about knowing what drives that number. This knowledge is your secret weapon, empowering you to see which levers—like boosting purchase frequency or, crucially, reducing churn—will have the biggest impact on your business’s long-term health. Metrics like NPS and CSAT are often the canaries in the coal mine for churn; check out our guide on how CSAT and NPS work together to see how they’re connected.
Turning Your CLV Number into Action
Alright, you’ve calculated your customer lifetime value. That’s a huge step, but the number itself is just the beginning. Its real power is unlocked when you turn that figure into business intelligence you can actually act on.
Think of it less as a simple metric and more as a strategic guide. It’s the compass that points you toward sustainable, profitable growth.
The first, and arguably most important, thing to do is weigh your CLV against your Customer Acquisition Cost (CAC). This simple comparison tells you if your growth engine is actually profitable or if you’re just spending a pound to make a pound (or worse, less). It’s the ultimate health check for your entire business model.
Understanding the CLV to CAC Ratio
The CLV to CAC ratio is exactly what it sounds like: a head-to-head comparison of how much value a customer brings in versus how much it cost you to get them through the door. For any SaaS or subscription business, this is one of the most vital metrics you can track. It tells you if your marketing efforts are creating real, long-term value.
A good rule of thumb for a healthy, scalable business is a CLV to CAC ratio of 3:1. This means for every pound you pour into acquiring a customer, you can expect to get three pounds back over their lifetime.
A 3:1 ratio is often seen as the sweet spot. It means you’ve got a solid business model that covers your acquisition costs and overheads, with enough left over for profit and reinvesting into growth.
This ratio gives you immediate, actionable insight:
- Less than 1:1: Houston, we have a problem. You’re losing money on every new customer. This is an all-hands-on-deck situation that demands an urgent strategy shift.
- Around 1:1: You’re basically breaking even on each customer. While it’s not a total disaster, there’s no profit to reinvest, which means your business will struggle to grow.
- 3:1 or higher: You’ve got a strong, efficient growth engine. This is the green light you’ve been waiting for—it’s time to confidently step on the accelerator with your marketing and sales spend.
The flowchart below breaks down the core components that build your CLV, which is the first half of this crucial ratio.
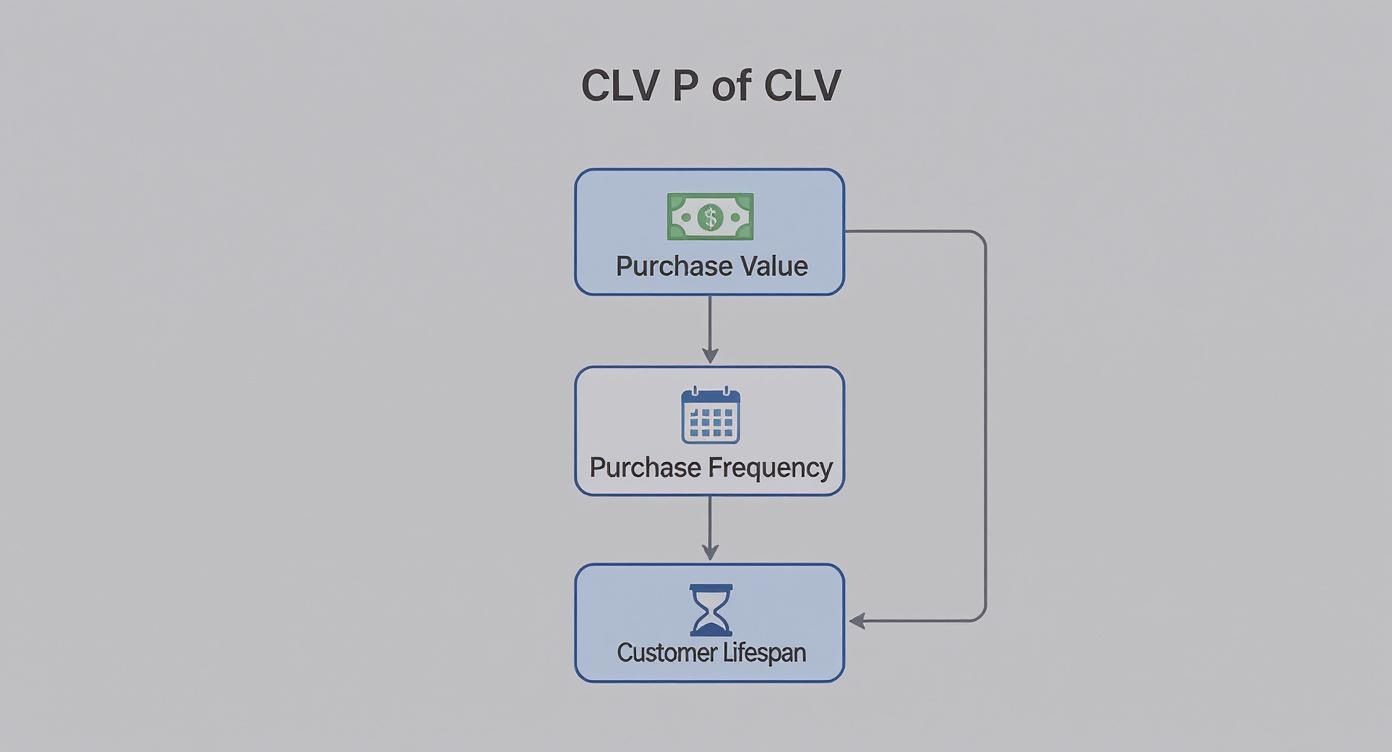
Getting a handle on how purchase value, frequency, and lifespan all mix together helps you see exactly which levers to pull to improve your CLV and, by extension, your entire business.
Segmenting Customers for Deeper Insights
While a company-wide average CLV is a great starting point, the real magic happens when you start segmenting. Not all customers are created equal; some are wildly more valuable than others. By calculating CLV for different customer groups, you can quickly uncover who’s really driving your profitability.
This is where you stop treating all your customers the same and start tailoring your strategies for maximum impact. A deeper understanding of customer success for SaaS platforms often starts right here, as it helps you focus your retention efforts where they’ll make the biggest difference.
Common Customer Segments to Analyse
Start by slicing your customer base into a few meaningful groups. Analysing the CLV for each one can reveal some surprising truths about your business.
1. High-Value Loyalists These are your champions. They spend more, they stick around for the long haul, and their CLV might be 5x to 10x higher than your average customer. Your goal here is simple: keep them deliriously happy and study their behaviour to find more people just like them.
2. Discount Shoppers These are the customers you hooked with a big promotion or a steep discount. The problem? They often have a rock-bottom CLV because they churn the second the offer expires. This segment can drag your overall average down, and you might discover they aren’t worth the acquisition cost in the first place.
3. Mid-Tier Regulars This is usually the biggest chunk of your customer base. They’re consistent but not spectacular. The real opportunity with this group is finding ways to nudge their CLV upwards over time—either by increasing their purchase frequency or upselling them to higher-value plans.
By moving beyond a single, blended average, your customer lifetime value calculator transforms into a precision instrument. It helps you focus your resources, sharpen your marketing, and build a much more profitable business by investing in the right customers.
Practical Strategies to Increase Your CLV
Alright, you’ve calculated your Customer Lifetime Value. That number staring back at you? It’s not the finish line; it’s the starting pistol. Now the real work begins: making that number grow.
Improving your CLV isn’t about finding one magic trick. It’s about a series of smart, deliberate moves that focus on your customers and add up over time. Think of this as your playbook for turning a good CLV into a great one by focusing on loyalty, nailing that first impression, and communicating like a human.
Double Down on Customer Onboarding
Those first few moments a new customer spends with your product are everything. A clunky, confusing onboarding experience is a one-way ticket to an early exit, and that’s a guaranteed CLV killer. Your one job is to get them to that “aha!” moment as fast as humanly possible.
Build a simple, streamlined flow that shows off the core value of your product right away. Use tooltips, checklists, and a friendly welcome email to guide them toward the features that solve their problems now. That early win builds confidence and makes them far more likely to stick around. A huge part of this is tackling the root causes of churn in SaaS before they take hold.
An effective onboarding isn’t just a product tour; it’s a value delivery system. It proves to the customer that they made the right choice and sets the stage for a long, profitable relationship.
A brilliant onboarding process showcases immediate value and can slash churn, directly boosting CLV from day one.
Implement a Tiered Loyalty Programme
Loyalty programmes are a classic for a reason—they just work. When you reward people for repeat business and sticking with you, you give them a solid reason to stay put instead of wandering off to a competitor. A tiered system is especially powerful.
This model creates a feeling of progress and exclusivity, nudging customers to spend a bit more to unlock the next level of perks.
- Bronze Tier: The entry point. Think small discounts or points on every purchase.
- Silver Tier: Better rewards for regulars, like early access to new stuff or free shipping.
- Gold Tier: The VIP room. This is for your best customers, offering exclusive benefits like dedicated support or invitations to special events.
This structure doesn’t just drive more frequent purchases; it helps you spot and pamper your most valuable customers, making them feel genuinely appreciated.
Leverage Personalised Upsell and Cross-Sell Opportunities
Let’s be honest: generic, one-size-fits-all marketing emails are mostly just noise. To actually increase what customers spend, you need to use their data to make smart, relevant recommendations. It’s about moving from spammy email blasts to genuinely helpful suggestions.
For example, an e-commerce store can suggest products based on what a customer has bought before. A SaaS company can prompt a user to upgrade their plan right when they start bumping up against the limits of their current one. Exploring proven customer retention marketing tactics is a great way to nail this.
When you get your marketing channels working together, the results can be massive. For instance, strategies that mix search and shopping ads have been shown to boost user lifetime value by an average of 25% and cut acquisition costs by 38%. Brands that bring paid search and social commerce together have seen conversion rates leap by 40% year-over-year.
The trick is all in the timing and relevance. A thoughtful upsell feels like good advice, not a sleazy sales pitch. It strengthens the relationship while boosting your CLV.
To help you decide where to start, here’s a quick breakdown of how these strategies stack up.
CLV Improvement Strategies and Their Impact
| Strategy | Primary Goal | Key Performance Indicator (KPI) |
|---|---|---|
| Improved Onboarding | Reduce early churn; increase user activation. | Time-to-value; 30-day retention rate. |
| Tiered Loyalty Programme | Increase purchase frequency and customer loyalty. | Repeat purchase rate; customer engagement score. |
| Personalised Upselling | Increase Average Revenue Per User (ARPU). | Upsell/cross-sell conversion rate; Average Order Value (AOV). |
Each of these tactics helps you build a more loyal and profitable customer base. They turn your CLV calculator from a tool that just tells you where you are into an engine that gets you where you want to go.
Common CLV Mistakes to Avoid
Calculating customer lifetime value puts a powerful lens on your business, but its clarity depends entirely on how you use it. Get it right, and you’ve got a roadmap for growth. Get it wrong, and you’re navigating with a broken compass.
A few common missteps can quickly turn this strategic tool into a source of flawed data, leading you down completely the wrong path. Let’s walk through the big ones so you can sidestep them and make sure your CLV is a reliable guide for growth, not a source of costly errors.
Using the Wrong Formula for Your Model
This is probably the most frequent mistake out there: grabbing a generic, one-size-fits-all formula and applying it to a business it was never designed for. An e-commerce store and a SaaS platform operate on fundamentally different financial rhythms. Their CLV calculations have to reflect that reality.
Using a simple e-commerce formula (based on average purchase value and frequency) for a subscription business is a classic blunder. This approach completely ignores churn rate—the single most important variable in a recurring revenue model. Without accounting for churn, your CLV will be wildly optimistic and practically useless for financial planning.
- E-commerce Mistake: Forgetting to factor in gross margin. Revenue is vanity, profit is sanity.
- SaaS Mistake: Ignoring churn. It’s the ultimate ceiling on how much a customer can ever be worth.
Always match the formula to your business model. It makes all the difference.
Relying on a Single Company-Wide Average
Another major pitfall is calculating a single, blended CLV for your entire customer base and just stopping there. Sure, a company-wide average gives you a quick snapshot, but it hides all the most valuable insights. This single number smooths out the massive differences between your best and worst customers.
Relying on one average CLV is like trying to navigate a city with a map that only shows the city limits. You know you’re inside, but you have no idea which streets are goldmines and which are dead ends.
Your most profitable customers might have a CLV that is 10x higher than your average, while your discount-chasers might barely break even. When you fail to segment, you end up treating both groups the same. You waste resources on low-value customers and fail to invest properly in your high-value loyalists.
Break down your CLV by acquisition channel, plan type, or even the first product they bought. That’s where you’ll find the real story of what’s driving long-term profit.
Treating CLV as a Static Number
Finally, a really dangerous mistake is to calculate CLV once and then treat it as a fixed, unchanging fact. Your business isn’t static, and neither are your customers. Market conditions shift, you release new features, your pricing evolves, and customer behaviour changes along with it.
Your CLV is a living metric. It needs to be revisited regularly—at least quarterly, if not more often. An outdated CLV will lead to poor decisions about your marketing spend and where you put your resources. For instance, if a product update significantly reduces churn, your old CLV calculation won’t reflect the increased value of new customers. You’d end up underinvesting in acquisition, leaving growth on the table.
Key Takeaway: Treat your customer lifetime value calculator as a dynamic dashboard, not a historical document. Continuously updating your inputs ensures your strategic decisions are based on what’s happening now, not what was true six months ago.
Got Questions About CLV? We’ve Got Answers.
Even with a slick customer lifetime value calculator at your fingertips, a few practical questions always pop up. This is where we tackle the common head-scratchers, giving you clear, straightforward answers to help you use CLV with confidence and sidestep the usual pitfalls.
We’ll dig into the nuances of timing, data gaps, and how this metric plays with the rest of your analytics toolkit.
How Often Should I Recalculate Customer Lifetime Value?
Think of CLV as a living, breathing metric, not some dusty number you calculate once and frame on the wall. For most businesses, crunching the numbers at least quarterly is a solid rule of thumb. This cadence is usually frequent enough to catch important shifts in customer behaviour, seasonal trends, or the impact of your latest marketing push.
However, if your business is in a high-growth spurt or you’ve just rolled out a major product update, you might want to switch to a monthly calculation. This gives you much quicker feedback, ensuring your big decisions are based on what’s happening right now, not what was happening three months ago.
What’s the Real Difference Between Historic and Predictive CLV?
The main difference is where they’re looking—one has its eyes on the past, while the other is focused firmly on the future.
-
Historic CLV is simple arithmetic. It’s the grand total of every pound a customer has ever spent with you. It’s a factual, after-the-fact number that tells you exactly who has been your most valuable customer. It’s useful, but it’s a history lesson.
-
Predictive CLV, on the other hand, is a forecast. It uses past data and a bit of statistical modelling to estimate the total future value a customer is likely to bring. This forward-looking view is where the strategic magic happens, helping you set marketing budgets or spot high-potential customers early on.
While historic CLV is precise, predictive CLV is strategic. Our advanced customer lifetime value calculator leans into the predictive model because that’s what truly fuels future growth.
Can I Use CLV for a New Business with Barely Any Data?
Absolutely, but you’ll need to get a little creative. A new business obviously doesn’t have years of customer data lying around, which makes the traditional calculation a bit tricky. The workaround? Start with industry benchmarks and some smart assumptions.
Kick things off by researching average churn rates and purchase frequencies for similar businesses in your field. You can then plug these proxy metrics into a CLV formula to get a starting point.
As you start gathering your own data over the first few months, you’ll continually swap out those initial assumptions with your actual numbers. This approach lets your CLV calculation evolve from an educated guess into a genuinely reliable, data-backed metric.
How Does CLV Connect to MRR and Churn?
CLV doesn’t live on an island; it’s deeply tangled up with other core SaaS metrics, especially Monthly Recurring Revenue (MRR) and Churn Rate. Think of them as a trio that, together, tells the complete story of your business’s health.
-
Churn Rate is a direct ingredient in the predictive CLV recipe. A lower churn rate means a longer customer lifespan, which directly increases CLV. In short, churn is the arch-nemesis of a high CLV.
-
MRR (via ARPA, or average revenue per account) is the other side of the coin. Boosting your MRR through upgrades or cross-sells increases the value each customer brings in every month, which in turn raises their lifetime value.
Ultimately, CLV is the metric that brings these two opposing forces—revenue coming in (MRR) and customers heading out (Churn)—into a single, powerful number that paints a clear picture of long-term profitability.
Ready to stop guessing and start calculating? HappyPanda provides the tools you need to collect the customer feedback that directly impacts retention and drives up your CLV. Discover how HappyPanda can help you build a more profitable customer base today.