
So, what exactly is an A/B test? At its simplest, it’s a head-to-head comparison between two versions of something—say, a webpage or an email—to see which one performs better. Version ‘A’ is your original (the control), and version ‘B’ is the new challenger you’re testing.
Why A/B Testing Is Your Secret Weapon
Imagine you’ve got two different headlines for your homepage. One is witty, the other is direct. Which one will convince more people to sign up for a trial? Instead of gathering the team in a room to debate it, you let your users decide. For a bootstrapped SaaS founder, this isn’t some fancy marketing trick; it’s a way to make smart, data-backed decisions that actually move the needle.
This method pulls you out of the world of opinions and into the world of facts. The conversation shifts from, “I think this will work,” to, “I know this works because the numbers prove it.” By testing your ideas systematically, you can make tiny, iterative improvements that stack up into massive gains over time.
The Core Principle of Testing
At its heart, an A/B test is a straightforward controlled experiment. You split your audience into two random groups. Group one sees the control version (A), and group two sees the new variation (B). Then, you sit back and measure which version gets you more of what you want—be it more clicks, sign-ups, or sales.
The real power of A/B testing is that it replaces subjective gut feelings with cold, hard data. Every digital experience is made up of countless little choices, and each one is a hypothesis about what will best serve both the user and the business.
This whole process is about learning directly from user behaviour. For a deeper look at how A/B testing fits into the bigger picture of user experience optimization, this guide is a great place to start.
From Guesswork to Growth
Look, most founders rely on intuition to get their products off the ground, and that’s essential in the early days. But as you scale, making decisions based on assumptions gets risky. And expensive. A single wrong guess about what users really want can lead to weeks of wasted development time and a ton of missed opportunities.
A/B testing acts as your safety net. It lets you validate your ideas with a small slice of your audience before you bet the farm on a full rollout. This approach helps you:
- Boost Conversion Rates: Discover the most effective messaging, designs, and user flows that turn more visitors into happy, paying customers.
- Slash Risk: Test new features or design tweaks on a subset of users first to make sure they’re actually an improvement before launching to everyone.
- Actually Understand Your Customers: Gain real insights into what your users prefer, helping you build a product that genuinely clicks with their needs and motivations.
When you build a culture of experimentation, your customer communication channels—from emails to onboarding flows—stop being simple messages and start becoming powerful growth engines. This guide will show you exactly how to do it.
Understanding the Numbers Without a Statistics Degree
Let’s be honest, the maths behind A/B testing can feel a bit intimidating. But you don’t need a PhD in statistics to get it right. To run experiments that actually give you trustworthy results, you just need to get your head around three core ideas: statistical significance, sample size, and test duration. Get these right, and you can be confident your decisions are based on real user behaviour, not just a random fluke.
What Is Statistical Significance?
Think of statistical significance as your confidence score. It’s a number that tells you whether the difference you’re seeing between Version A and Version B is the real deal or just dumb luck. The industry standard is to aim for 95% statistical significance. In simple terms, this means you’re 95% sure the result is genuine, and there’s only a 5% chance it happened by accident.
This is what a clear win looks like. The difference is big enough to confidently say one version is better than the other.
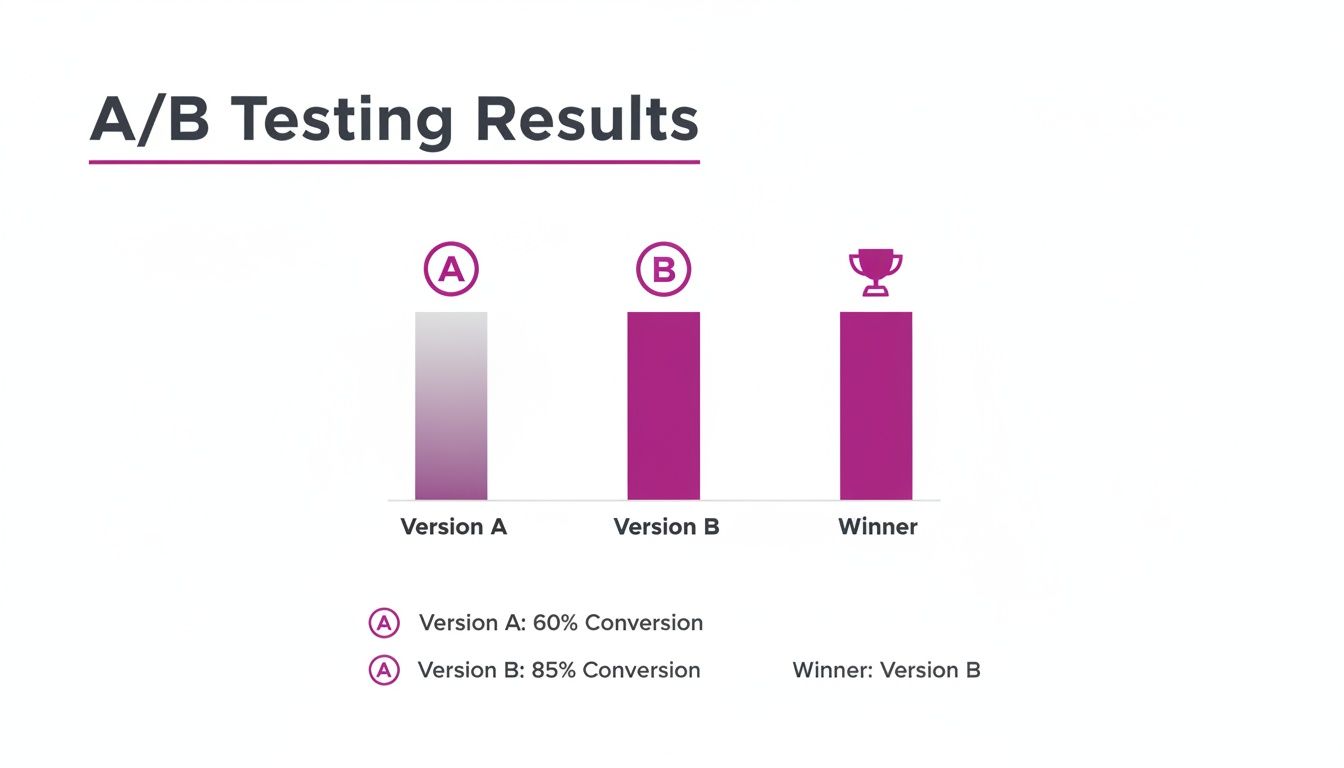
Here, Version B is the undisputed champion, giving you a clear signal for what to do next.
How Many People Do I Need for a Test?
Next up is sample size—the number of people who see each version of your test. If you only show your shiny new design to a handful of users, the results are basically meaningless. You need enough “votes” to be sure you have a true winner.
A good rule of thumb is to aim for at least 1,000 conversions per variation. I know, that can be a big number, especially for smaller SaaS companies. But the principle holds true no matter your size: the more data you collect, the more you can trust the outcome.
One of the biggest mistakes people make is stopping a test the second one version pulls ahead. It’s like calling an election after only a few polling stations report in. Early results are often misleading and rarely tell the full story.
How Long Should an A/B Test Run?
Finally, there’s test duration. This is all about running your experiment long enough to get the full picture. A user browsing your site on a Tuesday morning is probably in a different mindset than someone scrolling on a Saturday afternoon. To smooth out these weekly ups and downs, you should always run your tests for at least one full week—two is even better.
This gives you a much more balanced view of how people behave over a natural cycle.
Quick Guide to A B Test Parameters
Feeling a bit lost on where to start? This table gives you a rough idea of the sample size and test duration you might need based on your monthly traffic. It’s a starting point, not a perfect science, but it’ll get you in the right ballpark.
| Monthly Unique Visitors | Recommended Sample Size Per Variation | Estimated Test Duration |
|---|---|---|
| 10,000 | 2,500 | 4-6 weeks |
| 50,000 | 5,000 | 2-3 weeks |
| 100,000 | 7,500 | 1-2 weeks |
| 250,000+ | 10,000+ | 1 week |
Remember, these are just estimates! The actual time can vary based on your conversion rates. The key is to run the test until you hit both your target sample size and statistical significance.
If you’re looking to make sense of all this data without getting stuck in spreadsheet hell, tools that bring AI for data analysis in spreadsheets can be a massive help.
So, to recap the big three:
- Statistical Significance: Your confidence level that the results aren’t just random noise.
- Sample Size: The number of users you need to get a reliable result.
- Test Duration: The time needed to capture natural variations in user behaviour.
Keep these three pillars in mind, and you’ll be well on your way to running A/B tests that deliver solid, actionable insights you can actually use to grow your business.
How to Run Your First Customer Email A/B Test
Email is one of the most direct and powerful lines you have to your customers. It’s also the perfect place to dip your toes into A/B testing because the feedback loop is fast, and the insights can immediately boost engagement, retention, and even revenue.
Let’s skip the basic subject line tweaks and jump into an experiment with real impact—one that can shape your entire email strategy.
The point of your first a b test isn’t just to find a winner. It’s to learn something meaningful about your audience. Do they prefer a personal, plain-text feel from a founder, or does a polished, branded HTML email build more trust? Answering this one question can change how you talk to them everywhere.
Setting Up Your First Email Experiment
We’re going to start with a fundamental question about your welcome email. This is often the highest-opened email you’ll ever send, making it a goldmine for quick learnings.
Hypothesis: A simple, plain-text welcome email from “David at HappyPanda” will feel more personal and drive more clicks to our getting-started guide than a heavily branded HTML email.
Here’s how to structure this simple yet powerful test:
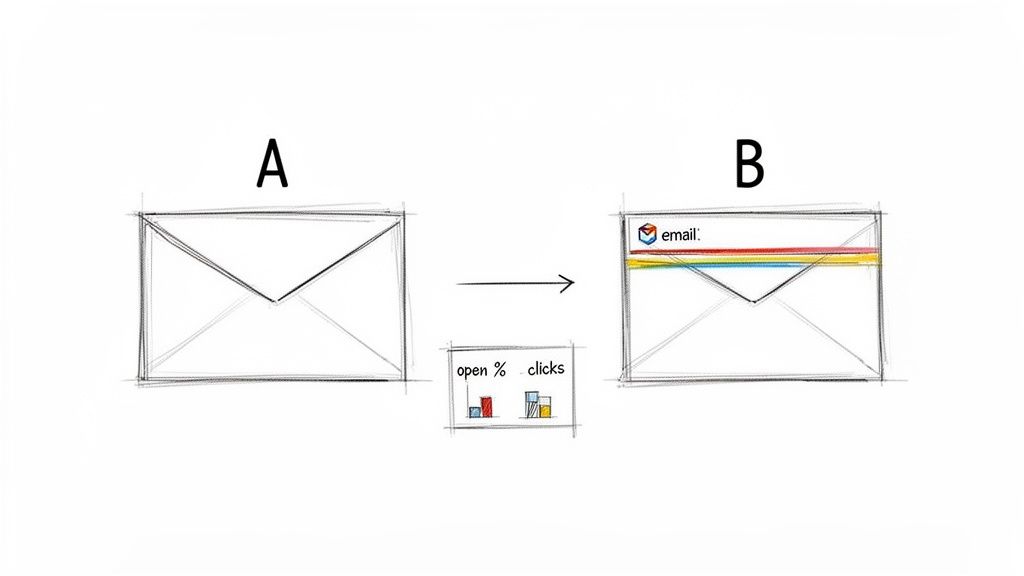
- Version A (The Control): Your current branded HTML welcome email. It has your logo, brand colours, and all the usual polish.
- Version B (The Variation): A new, plain-text email. Make it look like it was written directly from your personal inbox—a simple greeting, clear text, and a straightforward link.
With a platform like HappyPanda, setting this up is a breeze. You just create two versions of the first email in your welcome sequence and tell the system to split new signups 50/50 between them. Simple as that.
The beauty of an email A/B test is its clarity. You are testing one specific change to see its direct impact on user behaviour. Did they open it? Did they click the link? Did they take the desired action? The data gives you a clear answer.
Key Metrics to Watch
For an experiment like this, you need to look beyond a single number to get the full story. Don’t just glance at the open rate and call it a day.
Here’s what to track for your a b test:
- Open Rate: This tells you how effective your subject line and sender name are. For this test, keep them identical across both versions to isolate the impact of the email’s content.
- Click-Through Rate (CTR): This is the star of the show. It measures how many people who opened the email actually clicked the link to your guide. This is where you’ll likely see the biggest difference.
- Conversion Rate: The ultimate goal. Of the people who clicked, how many went on to complete a key activation step, like creating their first project?
Once your test has enough data to be statistically significant, check the results. If the plain-text version (B) has a much higher CTR and conversion rate, you’ve just learned your audience responds better to a personal touch. Boom.
That single insight can then be applied to your trial reminders, onboarding sequences, and even your churn-prevention campaigns. This one experiment does more than just optimise a single email; it gives you a foundational understanding of what makes your audience tick.
For more tips on crafting messages that hit the mark, check out our guide on how to start an email conversation with customers.
Optimising Your Onboarding with In-App Message Testing
A user’s first few moments with your product are make-or-break. This is their onboarding journey, the point where they decide if your SaaS is a keeper or just another tab to close. Instead of just guessing what makes them click, an A/B test on your in-app messages can give you concrete answers, directly boosting activation and keeping users around for the long haul.
This is where you stop theorising and start doing. It’s time to turn your onboarding flow into a finely tuned engine for user success.
Tiny tweaks during this phase can have a massive impact on whether someone sticks with you. It’s not just about showing off features; it’s about guiding them to their first win as smoothly and quickly as possible.
Finding Your Onboarding Winners
The name of the game is to find the friction points and test your way to a solution. Does that long checklist feel like a chore? Is that product tour more annoying than helpful? Let’s run an A/B test and find out for real.
Here are a few high-impact experiments you can run on your in-app onboarding:
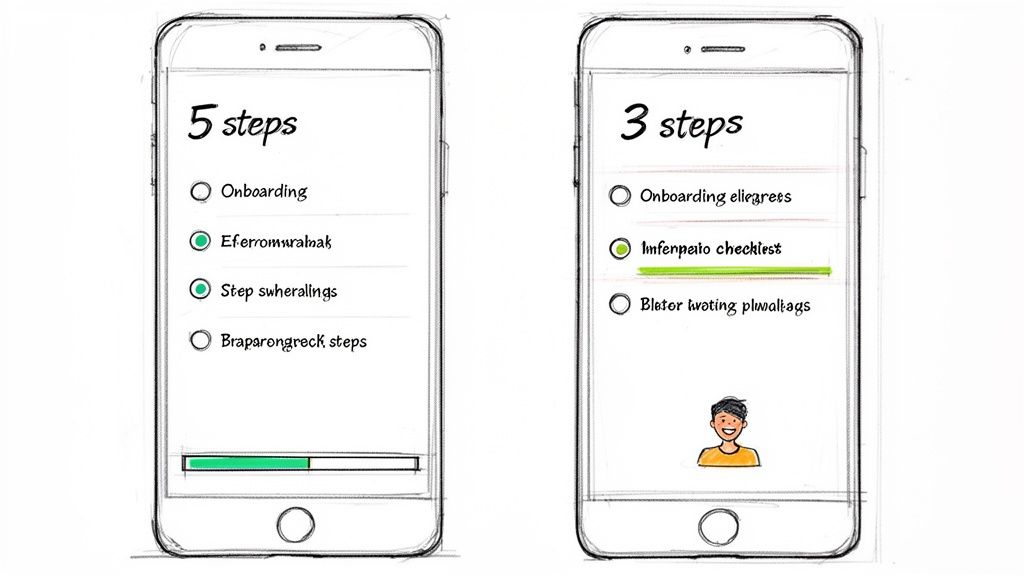
- Checklist Length: Pit a short, sweet 3-step checklist (Version A) against a more comprehensive 5-step version (Version B). The hypothesis? Fewer steps might just lead to a higher completion rate and faster activation.
- Tooltip Triggers: See what works better for your tooltips. Should they pop up automatically when a user lands on a page (A), or only appear when they hover over a specific element (B)?
- Product Tour Format: Compare a classic, multi-step guided product tour (A) with a set of self-serve “hotspot” hints that users can explore at their own pace (B).
For bootstrapped founders, this kind of optimisation isn’t a “nice-to-have” anymore; it’s essential. Take Southeast Asia’s digital economy, where this approach is becoming standard practice. Indonesian startups using behaviour analytics—which often includes A/B testing UIs—saw a 25% uplift in conversion rates for their onboarding flows. It’s solid proof that testing helps you get the most out of every resource.
Implementing and Tracking Your In-App Tests
Getting these experiments up and running in a tool like HappyPanda is refreshingly simple. You can create different versions of your onboarding checklists or tooltips and decide which user segments get to see each one. The system then takes care of tracking the results automatically.
But what numbers should you actually be watching?
The most important metric isn’t just “did they finish the checklist?” It’s “did finishing the checklist lead to better long-term outcomes?” You have to connect your test results to real business goals.
When running your in-app A/B test, keep your eyes on these key performance indicators:
- Activation Milestones: How many users in each group completed a critical task, like creating their first project or inviting a teammate?
- Time-to-Value (TTV): Measure how long it takes, on average, for a user in each variation to hit that “aha!” moment. A shorter TTV is a fantastic predictor of retention.
- Trial-to-Paid Conversion Rate: This is the ultimate test. Does one onboarding flow actually convince more people to pull out their credit cards?
By focusing on these metrics, you can be sure your tests aren’t just chasing vanity clicks. You’re genuinely improving the user journey and adding to your bottom line. You can learn more about how to structure these flows in our guide to designing effective user onboarding.
Using A/B Tests to Get Better Customer Feedback
We all know customer feedback is the lifeblood of a growing SaaS. But let’s be honest, the quality of that feedback often comes down to how and when you ask for it. An A/B test isn’t just for tweaking landing page conversions; it’s a seriously powerful tool for fine-tuning your entire feedback collection process.
Think about it. Instead of just blasting out a generic Net Promoter Score (NPS) survey and crossing your fingers, you can run simple experiments to discover what actually gets a response. This simple shift turns feedback from a passive, hope-for-the-best activity into an active growth strategy.
Simple Tests for Powerful Insights
Getting started is way easier than you might think. You don’t need a complex, lab-coat-wearing setup to learn something incredibly valuable. The entire goal is to isolate one single variable and see how it moves the needle on response rates and, more importantly, the quality of the feedback you get back.
Here are a few actionable ideas for your next A/B test:
- Survey Timing: When’s the perfect moment to ask for an NPS score? Try sending a survey 7 days after signup (Version A) against sending it 30 days after signup (Version B). You might discover that early feedback is all about the onboarding experience, while later feedback gets to the heart of your product’s true value.
- Request Channel: Pit an in-app survey pop-up (A) against a personal email request from the founder (B). One might get you a higher volume of responses, but the other could yield more thoughtful, detailed feedback. It’s a classic quantity vs. quality experiment.
The most effective feedback strategies aren’t set in stone; they’re built on a foundation of continuous experimentation. Small tweaks to your timing, channel, or messaging can dramatically improve both how much feedback you get and how useful it is.
Turning Happy Users into Powerful Social Proof
One of the best things to come out of collecting feedback is identifying your happiest customers—the ones who are practically waving a flag for your brand. An A/B test can help you turn that goodwill into powerful social proof by perfecting how you ask for testimonials.
For instance, once a user gives you a high NPS score (let’s say a 9 or 10), you can automatically trigger a follow-up. But what should that follow-up actually say?
- Version A: “Thanks for your feedback! Would you be willing to leave us a testimonial?”
- Version B: “So glad you’re loving the product! Your feedback helps us grow. Would you mind sharing a sentence or two about your experience for our website?”
Version B feels more personal and gives clear context for the request, which could give your response rate a serious lift. This isn’t just a theory. By integrating triggers like ‘NPS >=9 → testimonial request,’ some SaaS companies have seen huge gains. In fact, some Vietnamese SaaS companies that A/B tested their request timing after a positive NPS saw positive responses jump from 34% to 54%. You can dig deeper into how behaviour analytics drives these results by exploring the latest findings on the Asia-Pacific market.
These small, targeted experiments compound over time, helping you build a library of social proof that does the selling for you. For more strategies, check out our guide on how to collect customer feedback effectively.
Common Mistakes That Can Ruin Your Test Results
Running a flawed A/B test can be worse than not running one at all. Think about it: bad data doesn’t just waste your time; it gives you the confidence to make the wrong decisions, actively steering your product into a ditch.
Fortunately, most of these mistakes are surprisingly common and easy to sidestep once you know what to look for. The key is treating each experiment like the scientific process it is. Cutting corners will only introduce noise, leaving you with a fuzzy mess instead of a clear signal.
The Pitfall of Peeking Too Early
One of the most tempting mistakes is checking your results every few hours after launch. We’ve all been there. This habit, often called “peeking,” is a silent killer of good tests.
You see one variation pull slightly ahead after a day, and the urge to declare a winner and move on is almost overwhelming. Resist it. Early results are notoriously volatile, and random chance plays a massive role when your sample size is still small.
Stopping a test the second it hits statistical significance is a rookie move. You have to let it run for its planned duration to capture a true slice of user behaviour, including all the quirks of weekday versus weekend traffic.
A test needs time to breathe. By sticking to your predetermined sample size or duration, you’re protecting the experiment from your own biases and ensuring the final result is a genuine user preference, not just a statistical fluke.
Ignoring Outside Influences
Your product doesn’t exist in a bubble. External events can throw a massive wrench in your test results, and if you don’t account for them, your data will be completely contaminated.
Imagine testing an upgrade page during a huge holiday sale or right after a massive marketing campaign launch. The data you get will be skewed. A Black Friday promotion, for instance, introduces an urgency that has absolutely nothing to do with the button colour you’re testing. The sudden flood of discount-hungry users will behave very differently from your everyday audience, making your test results useless for normal conditions.
To avoid this, always have a handle on what’s going on around your business:
- Marketing Campaigns: Is a big promotion driving unusual traffic to your site?
- Holidays: Does your test overlap with a public holiday that might alter user habits?
- Product Launches: Did you just drop a major new feature that’s getting a ton of buzz?
Always try to run your experiments during a “normal” business period to get the cleanest possible read. If you can’t avoid an external event, at least make a note of it and consider re-running the test later to confirm your findings. By staying mindful of these common traps, you can make sure every A/B test delivers clean, trustworthy insights to build a better product.
The A/B Testing Questions You Were Afraid to Ask
Even when you’ve got the basics down, a few practical questions always pop up right before you hit ‘launch’ on your first A/B test. Here are some straight answers to the questions we hear most from SaaS founders, minus the dense academic speak.
How Long Should I Actually Run an A/B Test?
There’s no single magic number, but a solid rule of thumb is to let a test run for at least one full week. Why? Because user behaviour on a Tuesday morning is often wildly different from a Saturday night. A full week helps smooth out those peaks and valleys, giving you a much more reliable picture.
The real answer, though, depends on your traffic. Your goal isn’t just to run a test for a set time; it’s to gather enough data to be confident in the results. A good target to aim for is at least 100–200 conversions for each variation. Once you hit that, you can be pretty sure the outcome isn’t just a fluke.
Can I A/B Test if My Website Traffic Is Low?
You absolutely can, but you’ll need two things: a different strategy and a lot more patience. With less traffic, it’s going to take a whole lot longer to get enough data to mean anything. This is not the time for tiny tweaks.
When your traffic is low, you can’t afford to mess around with small changes like button colours. You need to swing for the fences. Think big, bold experiments—a total redesign of your pricing page or a complete overhaul of your onboarding flow. You’re looking for changes that are likely to create a massive, undeniable impact.
Just be prepared to let your test simmer for several weeks, maybe even a month, to collect the data you need to make a call.
What’s the Real Difference Between A/B and Multivariate Testing?
This one trips a lot of people up, but it’s simpler than it sounds.
-
An A/B test (or split test) is a straightforward duel. It pits two versions of one thing against each other to see who wins. Think Headline A vs. Headline B. Simple, clean, and direct.
-
Multivariate testing is more like a battle royale. It throws multiple changes onto a single page all at once to find the ultimate winning combination of elements.
For most bootstrapped SaaS founders, sticking with a simple A/B test is the smart move. The setup is easier, and the results are far clearer, letting you make quick, confident decisions and move on to the next experiment.
Ready to stop guessing and start testing? HappyPanda brings your email, onboarding checklists, and feedback tools together in one simple platform. It’s the easiest way to run your first A/B test without juggling a bunch of expensive, complicated tools. Get started with HappyPanda today.