Figuring out your Customer Satisfaction (CSAT) score is surprisingly straightforward. You just need one simple formula: divide the number of happy customers (the ones who rated you a 4 or 5) by the total number of survey responses you received. Multiply that by 100, and you’ve got your score. Think of it as an instant pulse check on how your customers are feeling in a specific moment.
Understanding The Core CSAT Formula
Before we get into the weeds, let’s nail down the basic math that powers the CSAT score. This isn’t a metric that tries to predict long-term loyalty; it’s all about the “here and now.” It’s a direct, real-time snapshot of how customers feel right after a specific interaction, like finishing a chat with your support team or making a purchase.
The standard approach uses a 1-to-5 rating scale, where the responses break down like this:
- 1 – Very Dissatisfied
- 2 – Dissatisfied
- 3 – Neutral
- 4 – Satisfied
- 5 – Very Satisfied
The key thing to remember is that only ratings of 4 (Satisfied) and 5 (Very Satisfied) count as positive. Everyone else—whether they’re neutral or actively unhappy—gets excluded from the “satisfied” group. It’s this sharp distinction that makes CSAT so clear and actionable.
Why This Calculation Works
The real strength of the CSAT formula is its simplicity and focus. By zeroing in on genuinely positive experiences, it stops “neutral” or lukewarm feedback from artificially inflating your score. This gives you a much more honest look at how many customers you’re truly delighting.
For example, if a bank gets 79 positive ratings out of 100 total responses, the CSAT score is a clean 79%. The formula is always the same:
CSAT = (Number of satisfied customers ÷ Total number of responses) × 100
This is the standard approach used across industries, making it a reliable benchmark for satisfaction.
A CSAT score isn’t just a number; it’s a conversation starter. It tells you exactly where your team is knocking it out of the park and where friction exists in the customer journey, pointing you toward immediate opportunities for improvement.
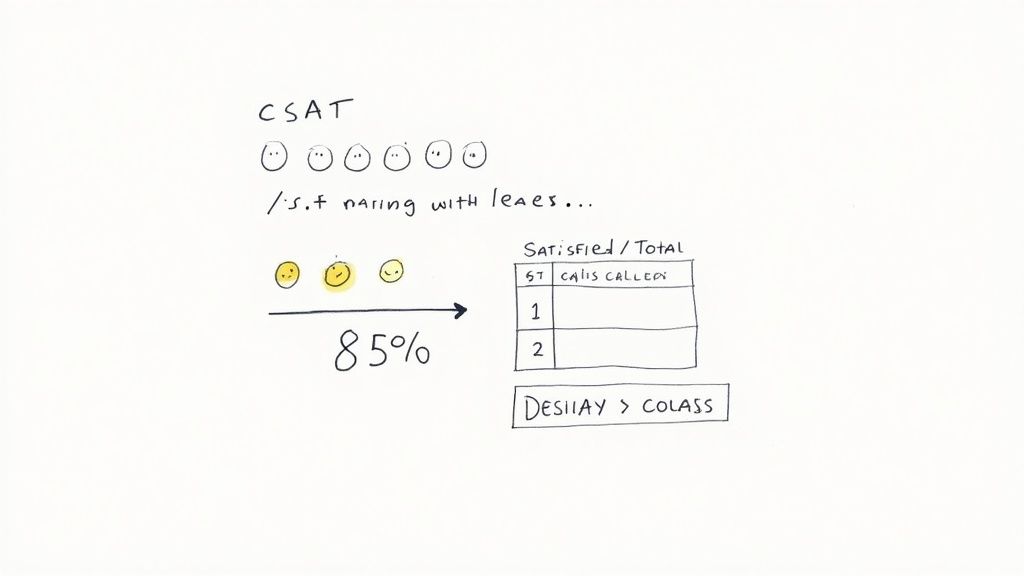
To help visualize this, here’s a quick look at how different response distributions translate into a final score.
CSAT Score Calculation At a Glance
This table breaks down a few scenarios to show how the final CSAT percentage is calculated based on the mix of satisfied and dissatisfied responses.
| Total Responses | Satisfied Responses (4s & 5s) | Dissatisfied Responses (1s, 2s & 3s) | CSAT Score (%) |
|---|---|---|---|
| 100 | 85 | 15 | 85% |
| 250 | 200 | 50 | 80% |
| 500 | 375 | 125 | 75% |
| 1000 | 920 | 80 | 92% |
As you can see, the score is a direct reflection of the proportion of happy customers, regardless of the total volume of feedback.
CSAT vs. Other Experience Metrics
It’s important to remember that CSAT measures satisfaction with a specific transaction, which sets it apart from other KPIs. A high CSAT score is fantastic, but it’s just one piece of the customer experience puzzle.
To get the full picture, many teams also track metrics like Net Promoter Score (NPS) to gauge overall loyalty and brand advocacy. Our guide on the differences between CSAT and NPS can help clarify which metric to use and when.
Of course, calculating the score is only the beginning. The ultimate goal is to act on the feedback you collect. Exploring proven strategies to improve overall customer satisfaction is the logical next step once you’ve got your baseline score.
Alright, let’s ditch the robotic tone and give this section a proper human touch. Here’s a rewrite that sounds like it came from someone who’s actually been in the trenches with customer feedback.
Real-World Examples of Calculating Your CSAT Score
Theory is great, but let’s get practical. How does this CSAT formula actually work day-to-day? I’ll walk you through three common scenarios, from a quick one-off survey to more complex weekly tracking. The math is simple enough for any spreadsheet, so you can start measuring customer happiness right after real interactions, like a support chat or a new purchase.
Example 1: The Single Survey Calculation
Let’s start simple. Imagine you just wrapped up a support chat with 30 customers and sent them a quick survey. Out of those 30 people, 18 gave you a 4 or a 5 (the “satisfied” scores). The rest were either neutral or unhappy.
To get your CSAT score, you just plug those numbers into the formula:
Divide the number of satisfied responses (18) by the total number of responses (30), then multiply by 100. That gives you a CSAT score of 60%. Easy. It’s a straightforward, industry-standard way to get a pulse on how you’re doing.
A few tips to make this even smoother:
- Set up a simple spreadsheet to automate the math. No one likes doing division over and over.
- Log your scores daily to start spotting trends.
- If you can, embed a web-based calculator that reports live scores to your team’s dashboard.
Key takeaway: Quick surveys can give you actionable satisfaction metrics in minutes. No complex analysis required.
Example 2: Aggregating Daily Scores for a Weekly View
A single score is a snapshot, but tracking CSAT over time tells a story. Are you getting better? Did a new feature release tank your satisfaction? To find out, you can collect feedback every day and then roll it up into a weekly score.
Let’s say your week looked something like this:
- Monday: 70%
- Tuesday: 75%
- Wednesday: 65% (uh oh, what happened here?)
- Thursday: 80%
- Friday: 72%
Instead of just looking at these in isolation, you can aggregate them. By totaling all the satisfied responses and all the total responses for the week, you get a much more stable weekly average. In this case, it comes out to 72.4%.
| Day | CSAT |
|---|---|
| Monday | 70% |
| Tuesday | 75% |
| Wednesday | 65% |
| Thursday | 80% |
| Friday | 72% |
This bigger-picture view helps smooth out the daily bumps and shows you the real trend.
Example 3: Using a Weighted Average for High-Priority Customers
Not all feedback is created equal. Sometimes, you need to give more weight to your most important customers—maybe your enterprise clients or long-term subscribers.
Let’s say you get 50 responses from your VIP customers, and their average satisfaction is 85%. You also get 150 responses from regular customers, who score you at 65%. A simple average wouldn’t reflect the importance of your VIPs.
A weighted calculation fixes this. By giving more importance to the VIP segment, you get a more representative score. In this case, the combined weighted average would be 70%. This method ensures the voices of your most valuable customers are heard loud and clear. If you want to dive deeper into the formulas, our friends at Crescendo have a great breakdown on different CSAT calculation methods.
To make all this number-crunching a bit more visual, here’s a look at how a tool like the HappyPanda CSAT calculator template maps everything out for you.
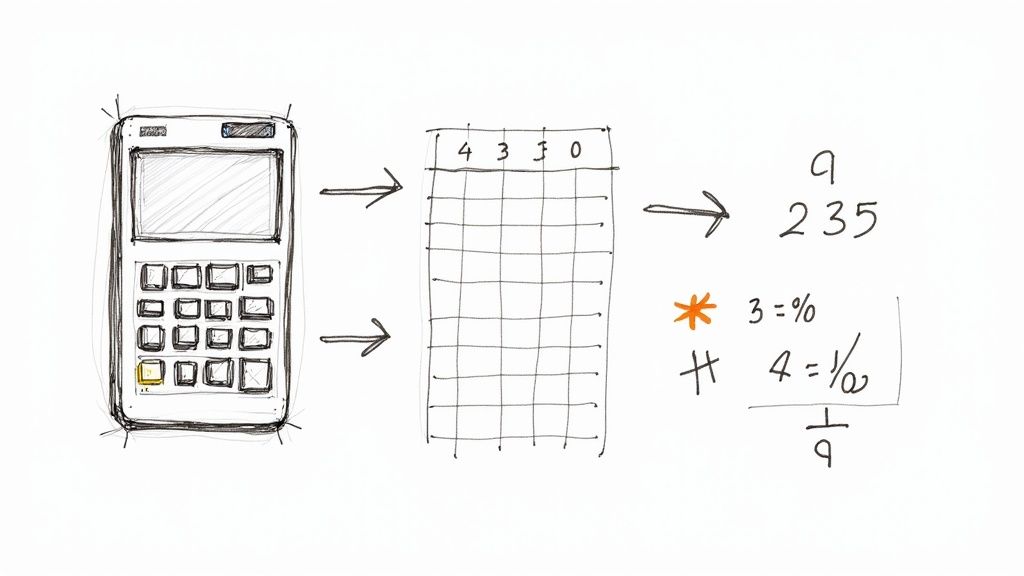
As you can see, a good tool automates the calculations and gives you a clean breakdown of satisfied customers vs. total responses, which helps you get quick insights without risking manual errors.
Putting It All Together with HappyPanda
Of course, calculating is only half the battle. You also have to collect the feedback in the first place. This is where HappyPanda comes in, helping you trigger CSAT surveys automatically after key moments, like when a support ticket is closed.
You can embed our widget directly into your app or site, then route the feedback straight to tools like Slack or Linear. This way, your team can follow up immediately.
Imagine automating your workflows so that low scores instantly ping a manager for intervention, while high scores get celebrated on your customer success dashboard. That’s how you turn feedback into action.
- Time it right: Make sure your survey pops up at the most relevant point in the customer journey.
- Use conditional logic: Tailor your follow-up questions based on the score they give.
- Look beyond the number: Always analyze the CSAT score alongside any comments for the full story.
With these examples and the right tools, you can move from just guessing to confidently tracking satisfaction, driving real improvements for your product and support teams.
Ready to see satisfaction soar? You can get a CSAT feedback loop running in just a few minutes.
Why not try our free CSAT score calculator today? Stop letting valuable feedback slip through the cracks and start turning it into action.
So, you’ve calculated your CSAT score. The first question that probably pops into your head is, “Is this any good?”
A score of 75% might feel decent, but what if I told you the industry standard was 65%? Suddenly, you’re not just average—you’re a top performer. Context is everything, and that’s where industry benchmarks come into play.
Your CSAT score doesn’t exist in a vacuum. Pitting it against industry averages helps you set realistic goals, understand your competitive standing, and figure out if your customer experience is an asset or a liability. Without that context, you’re flying blind.
Finding Your Place in the Market
Knowing where you stack up is the first step in building a solid strategy. Benchmarking tells you whether your customer experience is a competitive advantage or a weak spot that needs immediate attention.
Data from across different sectors shows just how much these averages can swing. For example, the retail and ecommerce world often boasts a strong average CSAT of 80%, with the software industry right behind at 78%. On the flip side, internet providers and social media platforms tend to hover around a less-than-stellar 68-70%. Meanwhile, the healthcare sector, which has really focused on patient experience lately, hit an impressive 81% in 2024.
This just goes to show why a one-size-fits-all approach to CSAT goals is a terrible idea. The expectations for a SaaS tool are worlds apart from those for a telecom company.
Using Benchmarks to Kickstart Improvement
Once you know your industry’s average, you have a powerful starting point. If you’re trailing behind, you’ve got a clear, data-backed case for investing in CX initiatives. If you’re ahead of the pack, you can focus on protecting that lead and setting even more ambitious internal goals.
To give you a quick reference point, here’s a look at how different industries generally compare.
Average CSAT Scores by Industry
This table offers a snapshot of typical CSAT score benchmarks across major industries. Use it to see how your performance measures up and get a feel for what “good” looks like in your specific field.
| Industry | Average CSAT Score (%) | Performance Indicator |
|---|---|---|
| Healthcare | 81% | Excellent |
| Ecommerce & Retail | 80% | Strong |
| B2B Software & SaaS | 78% | Good |
| Financial Services | 76% | Average |
| Telecommunications | 69% | Needs Improvement |
As you can see, the bar is set at different heights depending on the industry. A score that’s considered “Good” in B2B SaaS might be just “Average” in financial services, which underscores the importance of context.
A benchmark isn’t just a number to beat; it’s a diagnostic tool. A big gap between your score and the industry average often points to deeper issues in your service or product that need a closer look.
Ultimately, benchmarking turns your CSAT score from a simple metric into a strategic weapon. It gives you the context needed to make smart decisions and drive real change. For a deeper dive into turning these numbers into action, check out our guide on how to improve customer satisfaction.
Common Mistakes That Skew Your CSAT Results
On paper, calculating your CSAT score seems simple enough. But in practice, it’s a minefield of common traps that can paint a misleadingly sunny picture when things are actually a bit stormy. A few innocent missteps, and suddenly your dashboard looks fantastic while your customer experience is quietly falling apart.
Let’s get into the most common blunders we see teams make and how you can sidestep them.
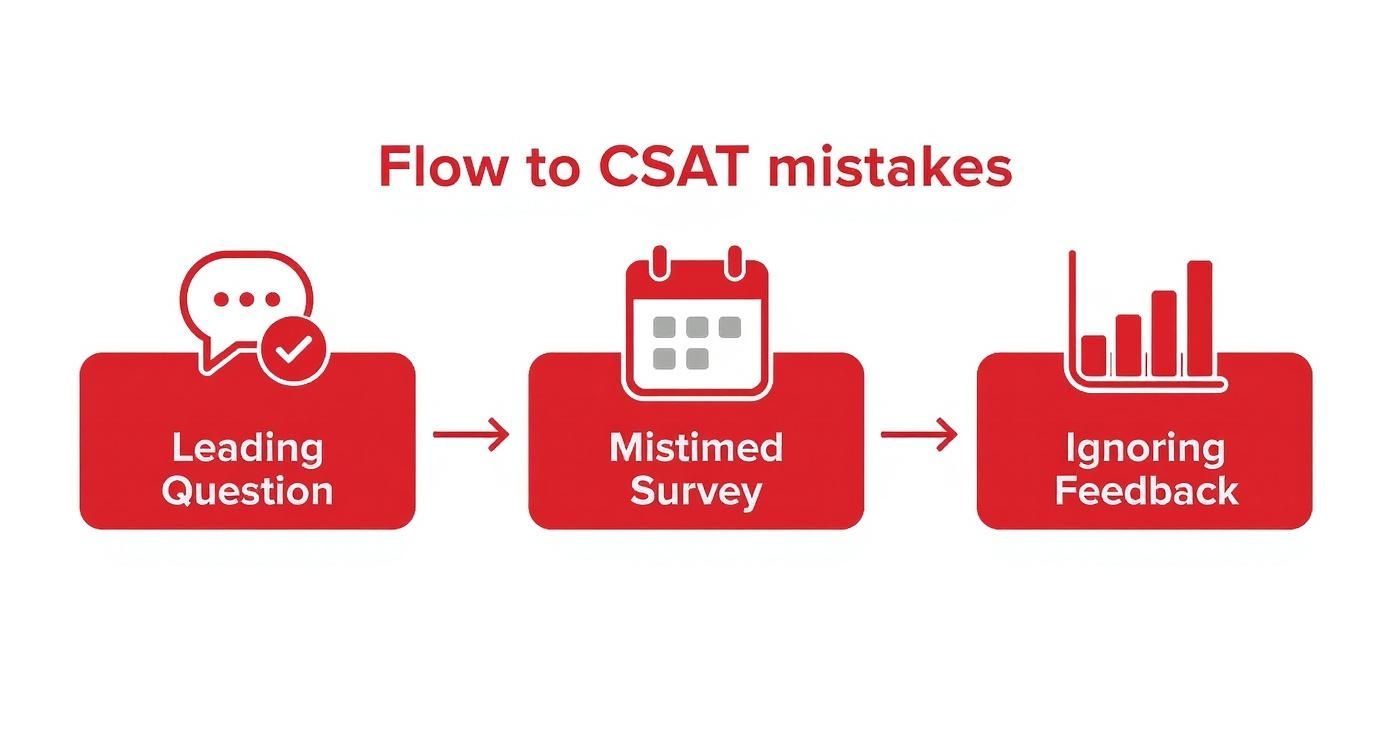
Sending Surveys Too Late
One of the biggest errors is asking for feedback long after the interaction is over. Think about it: when a survey pops into an inbox days after a support chat, the details are already fuzzy. That immediate feeling—whether it was delight or frustration—has faded. This delay can cause satisfaction scores to drop by as much as 20%, not because the service was bad, but because the memory is gone.
The fix is simple: timing is everything. Automate your surveys to go out the second an interaction ends. Trigger it the moment a support ticket is closed or right after a customer completes a purchase.
Key takeaway: Don’t wait. Sending your CSAT survey immediately after the interaction is the only way to capture an honest, in-the-moment response.
Asking Leading Questions
You’d be surprised how easily bias can sneak into your survey questions. Phrasing like, “How great was our amazing support team today?” practically begs for a positive answer, inflating your CSAT score by 15% or more. It feels good, but it’s not the truth.
You’re not fishing for compliments; you’re looking for genuine insight.
- Swap out loaded language like “awesome” or “excellent” for neutral phrasing.
- A simple change from “How was our awesome support?” to “How satisfied were you with our support?” makes a world of difference.
A great way to catch this is to have a few people outside your team read your survey questions. A fresh pair of eyes can spot accidental bias you might have missed.
Ignoring the “Why” Behind the Score
Focusing only on the number and ignoring the comments is like hearing a smoke alarm and not looking for the fire. That 2 out of 5 score doesn’t tell you much on its own, but the comment attached to it—“the agent was great, but the checkout page kept crashing”—is where the real gold is.
Don’t let that qualitative feedback go to waste. You need to collect those open-ended comments and funnel them right alongside the numeric scores. Inside HappyPanda, you can link these insights directly to the CSAT metrics, which helps your team see the full story and triage issues faster.
Every comment is a clue. Sometimes, a single customer quote can shine a light on a frustrating bug or a broken process that’s affecting hundreds of others.
Lumping All Your Data Together
This is a sneaky one. When you aggregate all your responses into one giant CSAT score, you risk hiding serious trouble spots. Your overall score might look healthy, but you could have one product line where 50% of users are deeply dissatisfied. Merging feedback from your power users with first-time casual browsers will absolutely mask the pain points of critical customer groups.
You have to segment your data. Slice it by user cohort, product line, subscription tier—whatever makes sense for your business. This is the only way to surface those hidden problems before they fester.
Actionable Tip: Use HappyPanda’s integrations to get surgical. You can set up rules to automatically route low scores from specific customer personas directly to a dedicated Slack channel for immediate attention.
Steering clear of these common mistakes will ensure your CSAT score is more than just a vanity metric. It’ll become a reliable compass pointing you toward real, actionable insights.
How to Automate CSAT Collection And Analysis
If you’re serious about scaling your CSAT program, it’s time to ditch the manual spreadsheets. The real magic happens when you use a dedicated csat score calculator built right into your feedback pipeline.
With a tool like HappyPanda, you can automate surveys to go out right after key customer interactions. This means you get instant, relevant metrics without lifting a finger.
The process is simple: surveys trigger automatically based on rules you set, like a support ticket being closed or a customer completing a purchase.
Setting Triggers And Workflows
The secret to high response rates is timing. You want to launch surveys when the experience is still fresh in your customer’s mind. A great way to do this is by setting triggers for moments like a support ticket closure or a successful checkout.
When a response comes in, it flows through a csat score calculator module that automatically tallies the positive ratings and spits out a percentage in real time. No more manual number-crunching.
This infographic breaks down some of the common pitfalls that automation helps you sidestep, like asking leading questions or sending surveys at the wrong time—mistakes that can skew your results before they even reach your team.
Integrating With Slack And Dashboards
Once the data is collected, you need to get it in front of the right people—fast. HappyPanda can push alerts for low CSAT scores directly to your team’s Slack channels or email groups, so nothing falls through the cracks.
A live dashboard gives you a bird’s-eye view of trends over time, and you can even link out to detailed feedback in your favorite project management tool. We’ve found that automating CSAT collection reduces manual errors by over 80% and gives response rates a healthy boost.
Automating feedback workflows turns CSAT into a real-time pulse for your team, not just a report you look at once a month.
When you’re building out your surveys, you can get pretty creative. Exploring tools like online quiz makers can give you powerful options that go way beyond simple forms. For more inspiration, check out our guide with examples and templates for customer feedback forms.
Here are a few best practices we’ve seen work wonders:
- Time your surveys to appear within 30 seconds of an interaction.
- Automatically segment and route low scores for immediate follow-up.
- Make it a habit to review weekly CSAT trends in your dashboard.
One SaaS team we worked with saw a 40% jump in survey responses just by switching to automated triggers and real-time CSAT calculations. This means their product backlog is now informed by fresh, accurate data instead of delayed manual updates.
With a good setup, your csat score calculator becomes a growth engine. It can automatically route positive feedback into your CRM for testimonials while low scores create new tickets in your support system. It’s a live feedback loop that frees your team to focus on analyzing comments, not crunching numbers.
Common Questions About CSAT Scores (Answered)
Even with the CSAT formula down pat, a few questions almost always pop up when teams first start weaving feedback into their workflow. Nailing these details can be the difference between collecting vanity metrics and gathering insights that actually move the needle. Let’s clear up some of the most common uncertainties.
How Often Should I Send CSAT Surveys?
The golden rule here is simple: ask for feedback immediately after a specific interaction. You’re trying to capture your customer’s gut reaction while the experience is still fresh in their mind. Waiting even a day can muddy the waters and reduce the accuracy of the feedback.
Your timing and frequency should feel like a natural part of the customer journey. Think about the key moments where feedback would be most valuable:
- Support Interactions: The second a support ticket is closed or a chat ends is the perfect time to ask, “How did we do?”
- After a Purchase: Trigger the survey right on the confirmation page or in the receipt email. It’s a seamless way to check in.
- During Onboarding: Ask for a quick rating right after a customer completes a major setup step. It tells you if your process is as smooth as you think it is.
The trick is to focus on these transactional moments instead of blasting out surveys on a random schedule.
Don’t bombard your customers. CSAT is most powerful when it’s tied to a specific event. Over-surveying is a real problem—it leads to survey fatigue and tanks your response rates. Be strategic and pick your moments.
What Is The Difference Between CSAT, NPS, And CES?
Great question. While all three are customer experience metrics, they measure very different things and answer different questions. I like to think of them as complementary tools in your CX toolkit—you wouldn’t use a hammer to turn a screw.
Here’s a simple way to break it down:
| Metric | What It Measures | The Real Question It Answers |
|---|---|---|
| CSAT | Short-term happiness with a specific interaction or product. | ”How satisfied were you with that thing that just happened?” |
| NPS | Long-term loyalty and the likelihood a customer will advocate for you. | ”Are you willing to put your reputation on the line for us?” |
| CES | How easy it was for a customer to get something done. | ”How much work did you have to put in to solve your problem?” |
In short, CSAT tells you “how happy are they right now?” NPS helps predict future growth, and CES shines a light on friction points in your processes. Using them together gives you a much richer, more complete picture of your customer experience.
Can I Use A Different Rating Scale For CSAT?
Absolutely. While the 1-5 scale is the industry standard for a reason (it’s simple and widely understood), CSAT is surprisingly flexible. You can easily adapt the scale to fit your needs, whether it’s a dead-simple 3-point scale or a more granular 7-point one.
Just remember, the calculation method needs to be adjusted accordingly.
For a 3-point scale (like Unhappy, Neutral, Happy), you’d almost always count only the “Happy” responses as satisfied. If you’re using a 7-point scale, you might decide that scores of 6 and 7 count as your “satisfied” customers.
The most crucial part is consistency. Once you pick a scale, stick with it. Changing your scale mid-stream will completely skew your data and make it impossible to track your score accurately over time. The core principle never changes: define what “satisfied” means for your scale, and then calculate the percentage of people who hit that mark.
Ready to stop guessing and start measuring? With HappyPanda, you can automate your CSAT collection and route feedback directly into the tools your team already uses. Turn insights into action and build a feedback loop that drives real growth. Start your free trial today.